Open Access
Fig. 8
Download original image
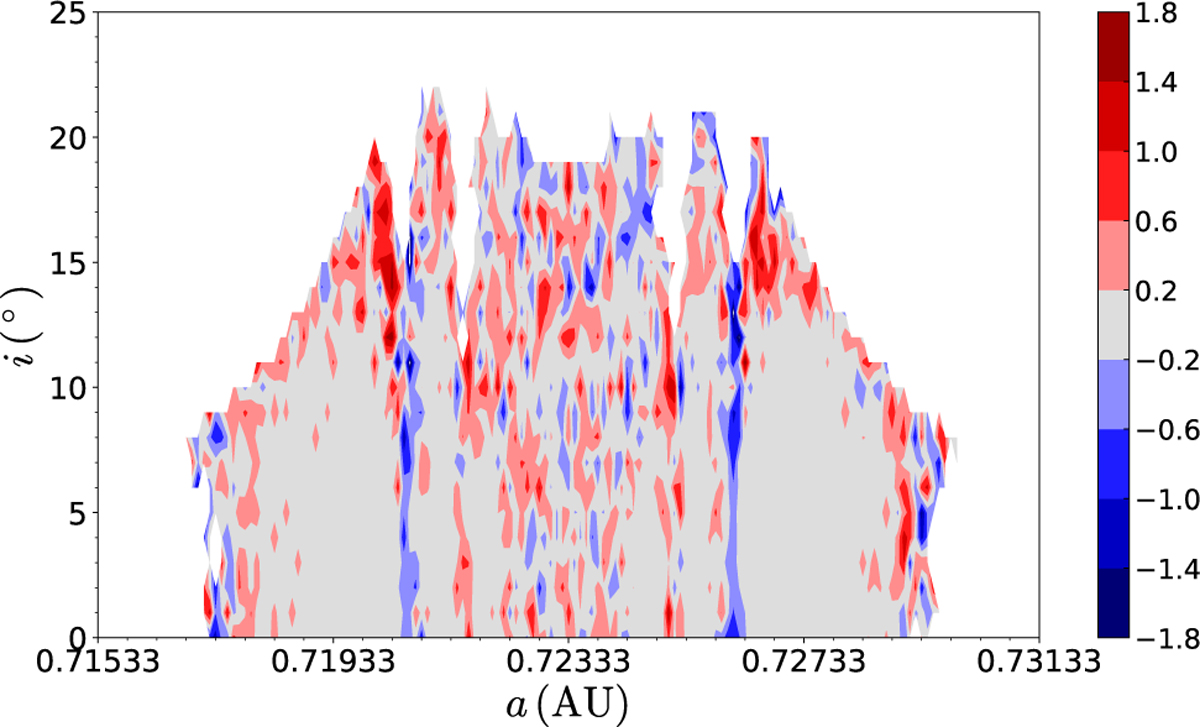
Effect of GR in the VT region. The colour bar represents log10(T1/T2) (see text). Thus grey means that the lifetimes in both models are the same (4.5 Gyr), while red indicates that the corresponding orbit is destabilised to some extent by GR (T1 > T2), and blue is the opposite.
Current usage metrics show cumulative count of Article Views (full-text article views including HTML views, PDF and ePub downloads, according to the available data) and Abstracts Views on Vision4Press platform.
Data correspond to usage on the plateform after 2015. The current usage metrics is available 48-96 hours after online publication and is updated daily on week days.
Initial download of the metrics may take a while.