Fig. 3
Download original image
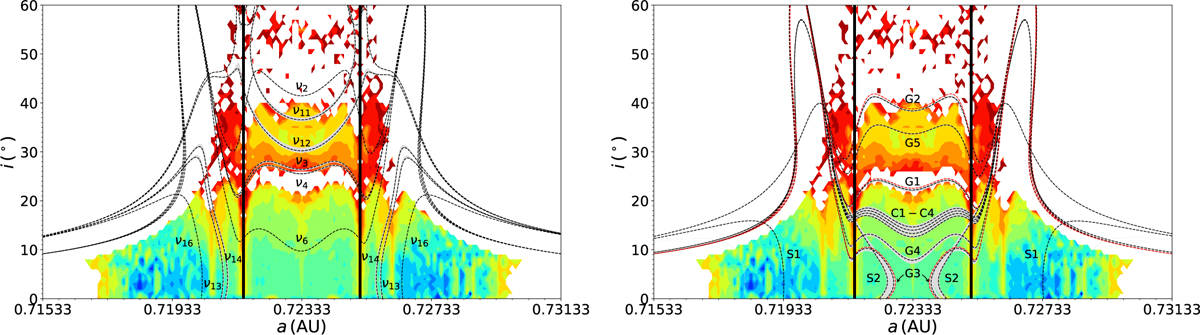
Secular resonances over the short-time (1.34 × 10⁶ yr) dynamical map on the (α0, i0) plane (see text for the explanations of the labels along the curves). The left panel depicts the linear secular resonances, and the right panel depicts the fourth-degree secular resonances. The tadpole and horseshoes orbits are separated by the vertical dark lines. Grey shadows delimit the coverage areas of the resonances considering the frequency drift of the inner planets. The distinguishable locations of secular resonances deduced from the model including GR effect are indicated by the dashed red lines (see text).
Current usage metrics show cumulative count of Article Views (full-text article views including HTML views, PDF and ePub downloads, according to the available data) and Abstracts Views on Vision4Press platform.
Data correspond to usage on the plateform after 2015. The current usage metrics is available 48-96 hours after online publication and is updated daily on week days.
Initial download of the metrics may take a while.