Open Access
Fig. 2
Download original image
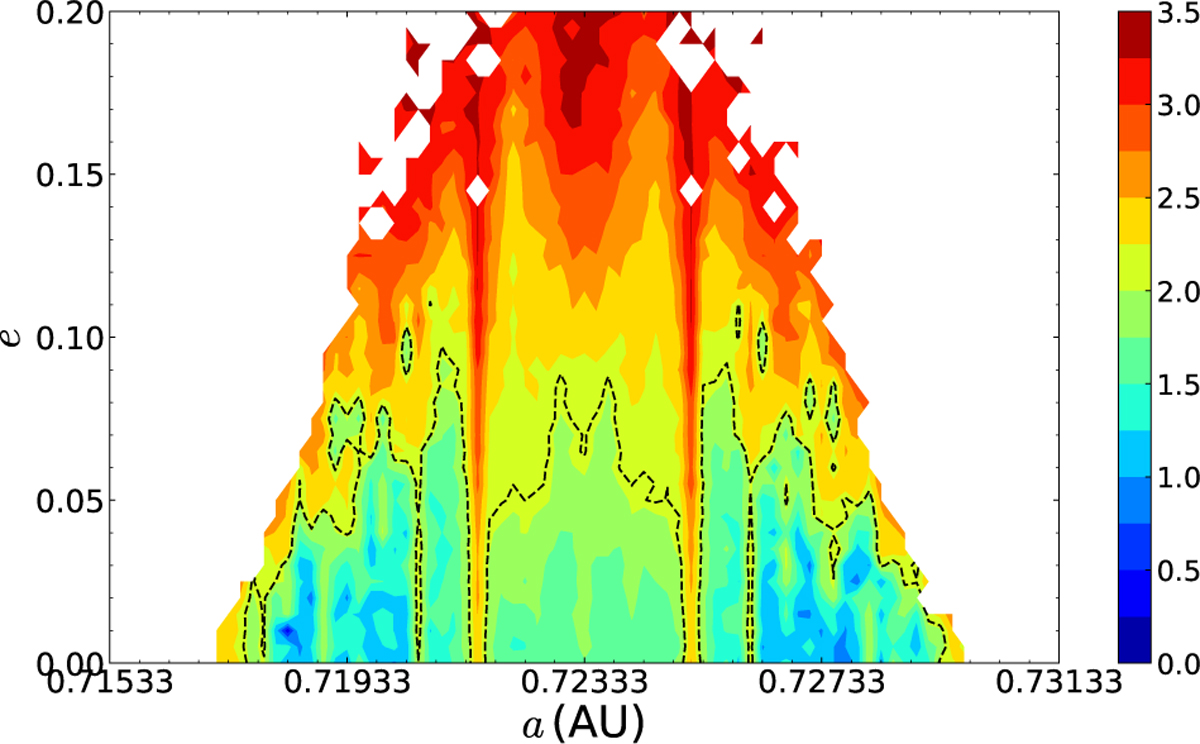
Dynamical maps around the L4 point of Venus on the (a0, e0) plane for an integration time of 1.34 × 10⁶ yr. The colours indicate the base-10 logarithm of SN of cos σ for orbits surviving the integration time. The dashed contour curve indicates log10 SN = 2.06 (see text for details).
Current usage metrics show cumulative count of Article Views (full-text article views including HTML views, PDF and ePub downloads, according to the available data) and Abstracts Views on Vision4Press platform.
Data correspond to usage on the plateform after 2015. The current usage metrics is available 48-96 hours after online publication and is updated daily on week days.
Initial download of the metrics may take a while.