Fig. 6.
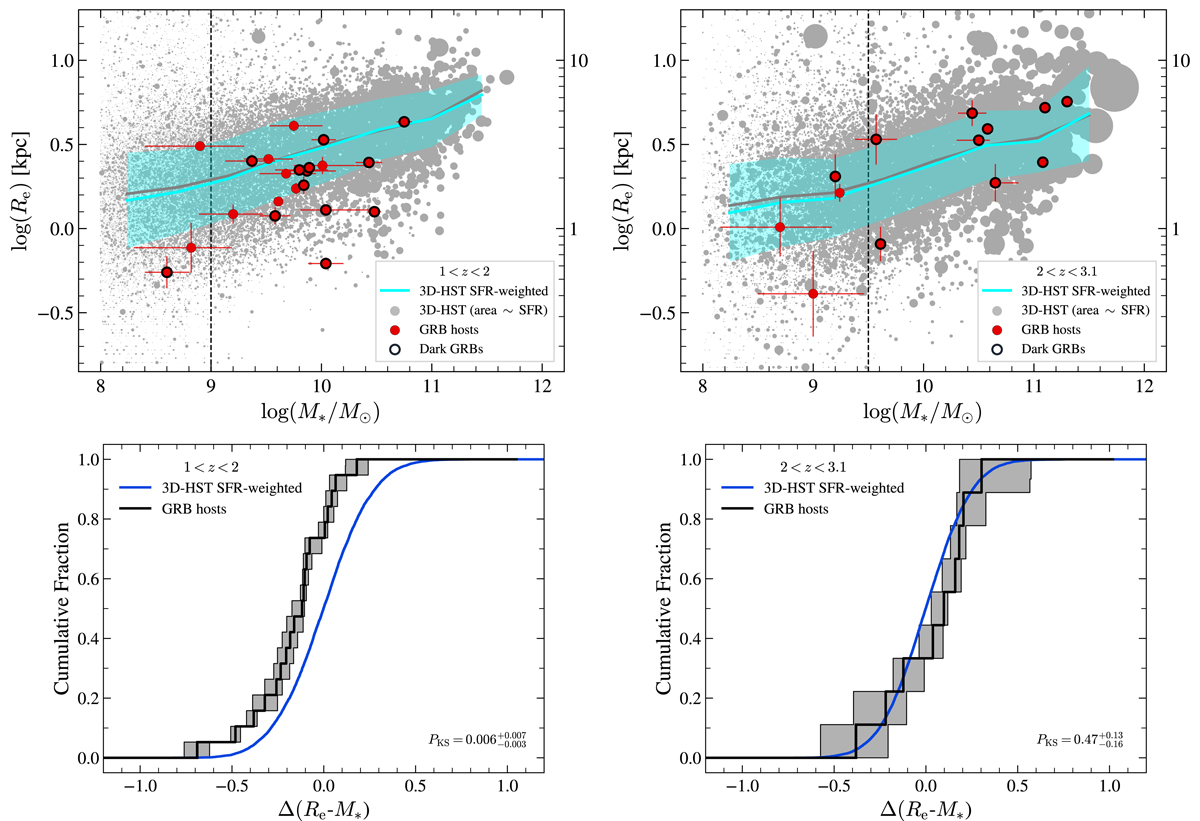
Download original image
Size-mass relations and size deviations of GRB hosts from star-forming galaxies. Top panels: half-light radius against stellar mass for GRB hosts and star-forming galaxies at 1 < z < 2 (left panel) and 2 < z < 3.1 (right panel). The GRB host galaxies are displayed as red circles and the 3D-HST star-forming galaxies are shown as gray circles with an area proportional to their SFR. The median of the star-forming population is shown as a dashed gray line. The dashed cyan line represents the expected median of a GRB hosts population that does not suffer from bias to trace the SFR (gray circles weighted by their SFR). The 1σ uncertainty of the cyan median is given as a shaded cyan region. The vertical dashed black line is the mass-completeness limit of the 3D-HST survey. Bottom panels: cumulative distribution of Δ(Re − M∗) at 1 < z < 2 (left panel) and 2 < z < 3.1 (right panel). The Δ(Re − M∗) represents the distance between GRB hosts and the SFR-weighted Re − M∗ relation of the top panels. The blue curve is a Gaussian CDF with a mean of 0 and a standard deviation defined by the 1σ errors of the shaded cyan area at the GRB hosts positions. The p-value returned by the two-sided K–S test is provided in the right bottom part of panels.
Current usage metrics show cumulative count of Article Views (full-text article views including HTML views, PDF and ePub downloads, according to the available data) and Abstracts Views on Vision4Press platform.
Data correspond to usage on the plateform after 2015. The current usage metrics is available 48-96 hours after online publication and is updated daily on week days.
Initial download of the metrics may take a while.