Fig. 2.
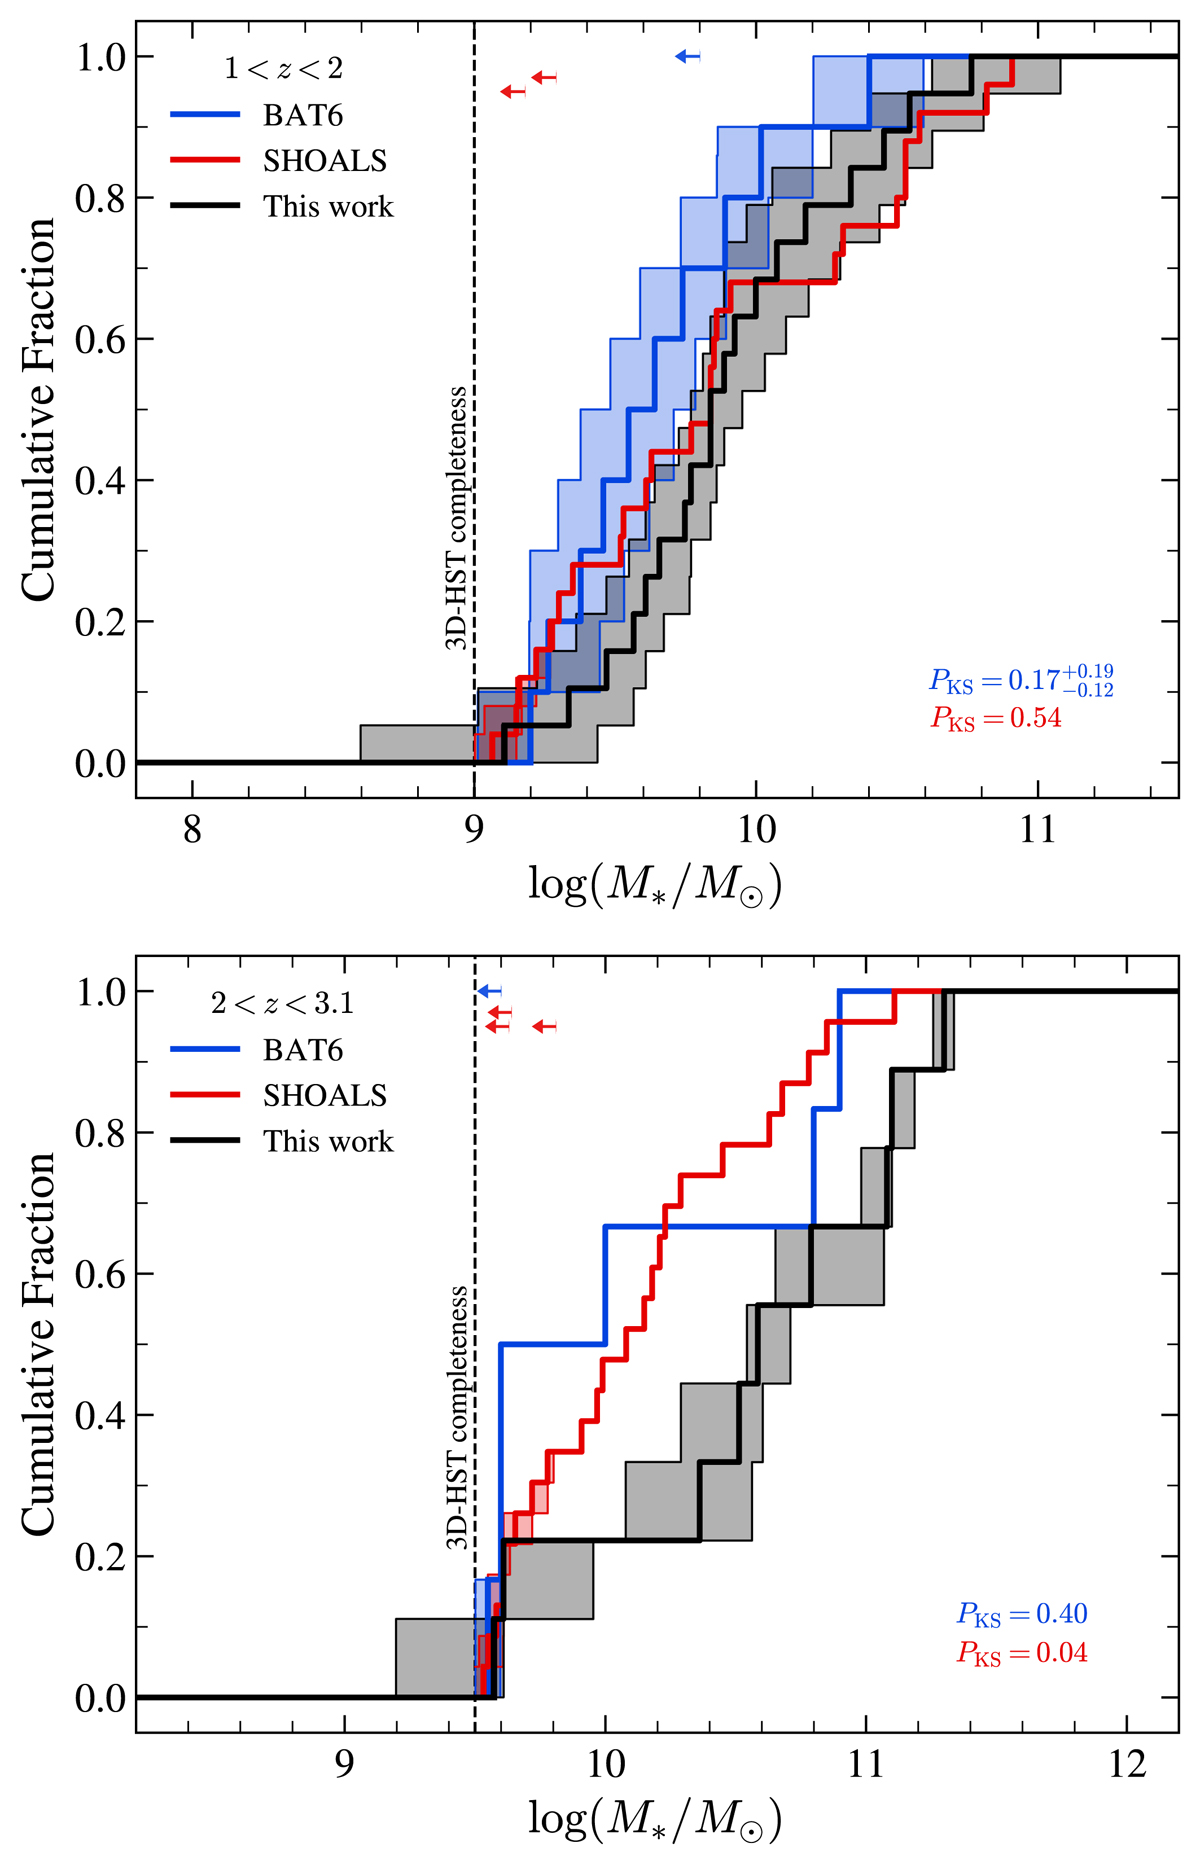
Download original image
Stellar mass cumulative distributions of our GRB host sample, compared to the host galaxies of unbiased GRB samples (SHOALS and BAT6). Two bins of redshift are distinguished: with GRB hosts at 1 < z < 2 (top panel) and with objects at 2 < z < 3.1 (bottom panel). Upper limits are represented as arrows at the top of the plots. The 1σ uncertainty on the cumulative distribution is given by the shaded region around the curve. The p-value returned by the two-sided K–S test is provided in the right bottom part of both panels and color-coded according to the unbiased sample selected to compute the test. The vertical dashed line symbolizes the stellar mass completeness limit of the 3D-HST survey.
Current usage metrics show cumulative count of Article Views (full-text article views including HTML views, PDF and ePub downloads, according to the available data) and Abstracts Views on Vision4Press platform.
Data correspond to usage on the plateform after 2015. The current usage metrics is available 48-96 hours after online publication and is updated daily on week days.
Initial download of the metrics may take a while.