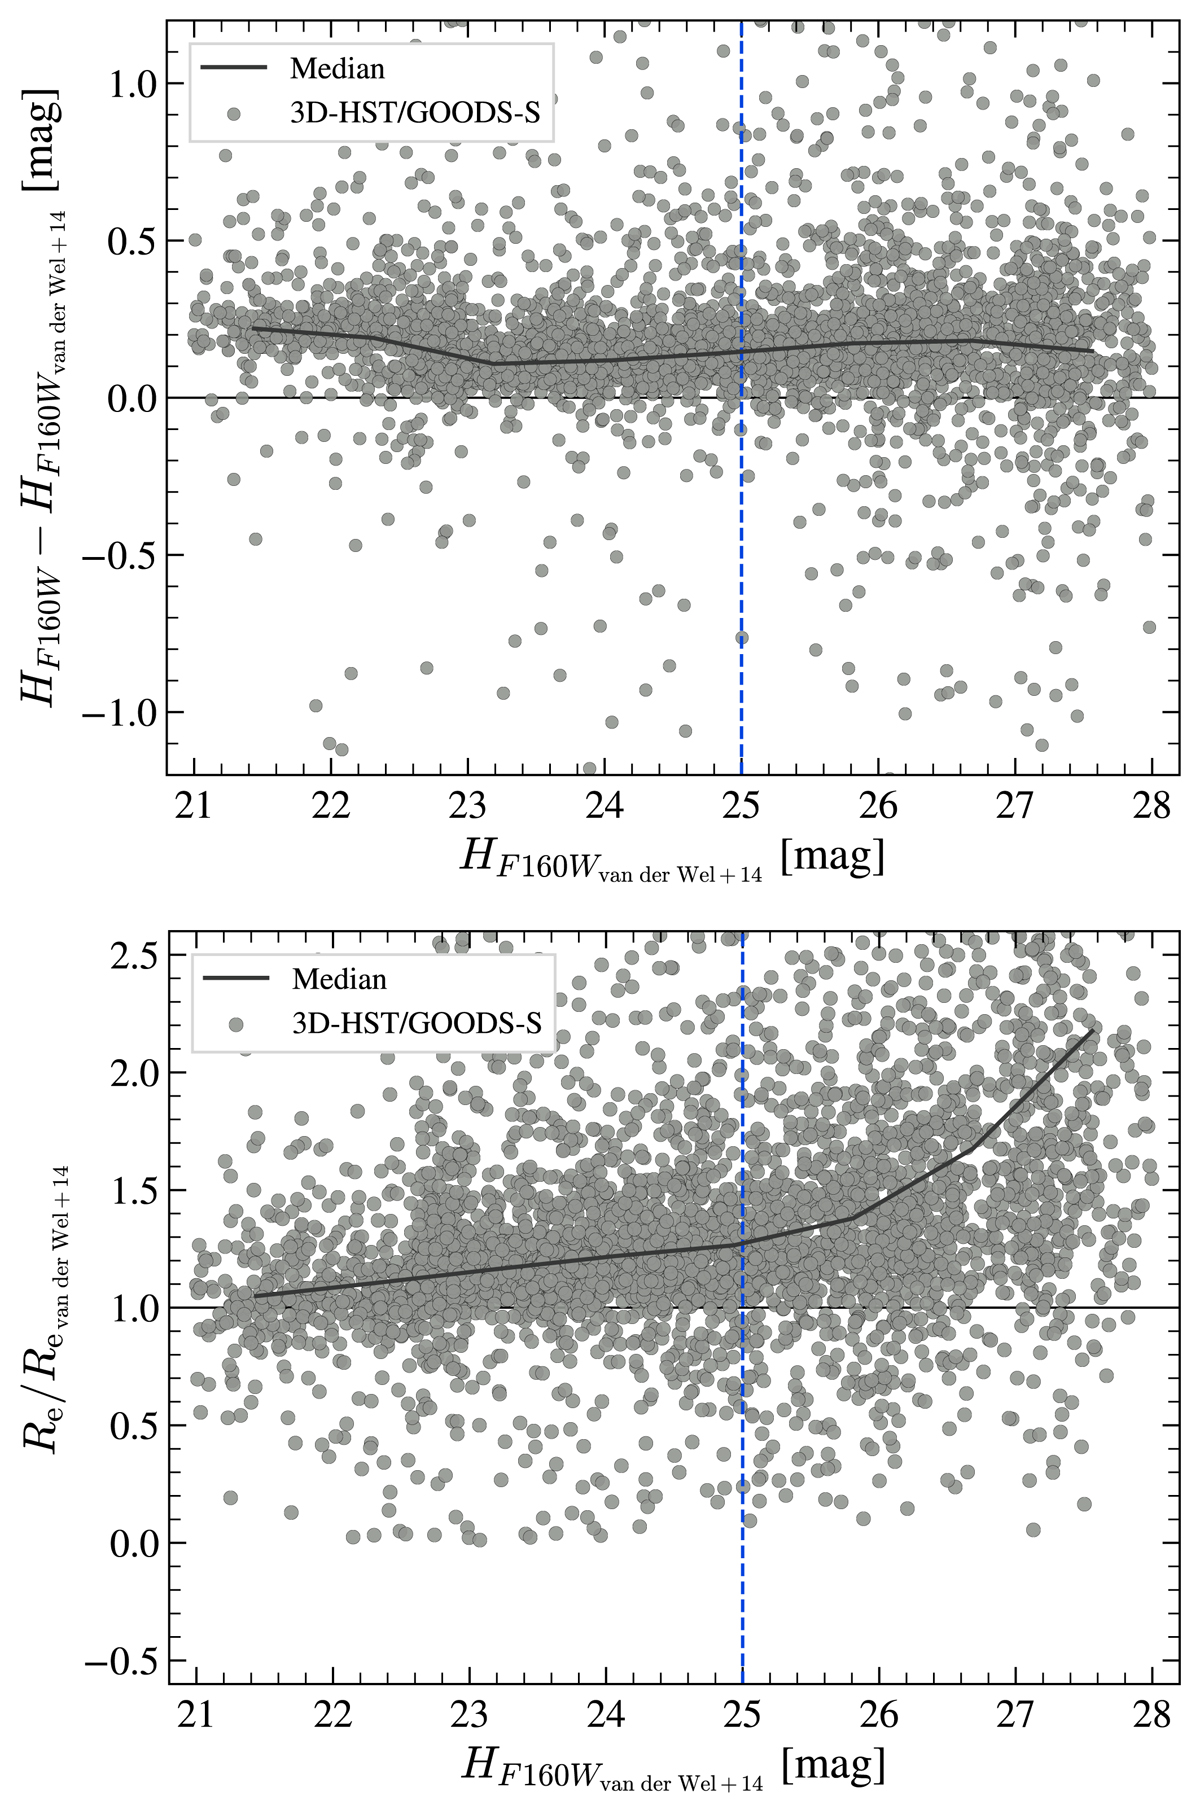
Fig. B.1.
Download original image
Comparison between F160W magnitudes (top panel) and half-light radii (bottom panel) derived by van der Wel et al. (2014) and our GALFIT modeling as a function of van der Wel et al. (2014) magnitudes. Each gray point represents an object of the 3D-HST/GOODS-S field. The gray curve is the median of the points and symbolizes the systematic offset for each parameter between the two methods. The vertical dashed blue line represents the maximum magnitude reached by GRB hosts above the 3D-HST mass-completeness limit, while our median H-band magnitude reaches ∼23.1 mag.
Current usage metrics show cumulative count of Article Views (full-text article views including HTML views, PDF and ePub downloads, according to the available data) and Abstracts Views on Vision4Press platform.
Data correspond to usage on the plateform after 2015. The current usage metrics is available 48-96 hours after online publication and is updated daily on week days.
Initial download of the metrics may take a while.