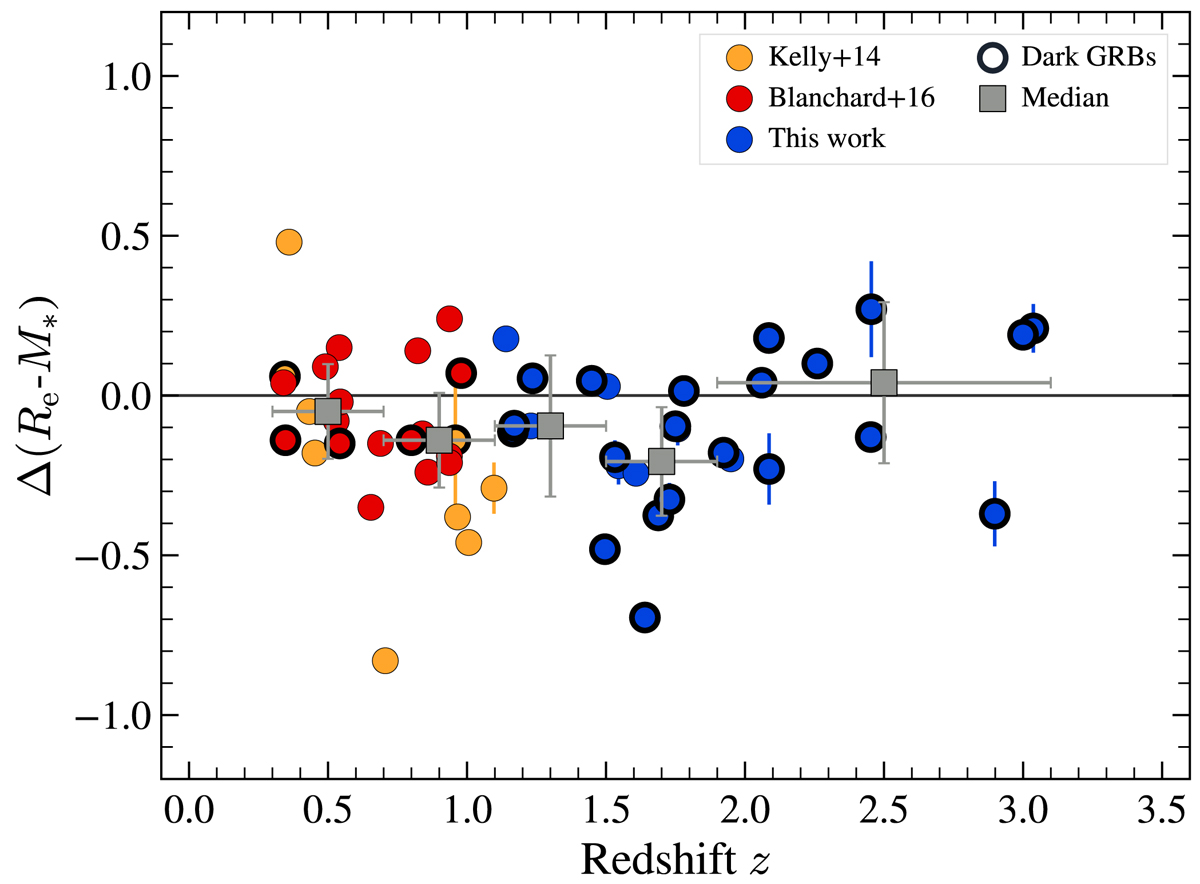
Fig. 10.
Download original image
Δ(Re − M∗) as a function of the redshift for GRB host galaxies. The orange and red circles are GRB hosts at z ≲ 1 from Kelly et al. (2014) and Blanchard et al. (2016), respectively. The blue circles are the GRB hosts considered in this study. Dark GRBs are highlighted by a thick black circle. The gray squares are the median of the Δ(Re − M∗) for each redshift bin. The associated error bars are the standard deviation using the MAD estimator. The black line at y = 0 represents the expected median values for a GRB hosts population that do not suffer from environment bias.
Current usage metrics show cumulative count of Article Views (full-text article views including HTML views, PDF and ePub downloads, according to the available data) and Abstracts Views on Vision4Press platform.
Data correspond to usage on the plateform after 2015. The current usage metrics is available 48-96 hours after online publication and is updated daily on week days.
Initial download of the metrics may take a while.