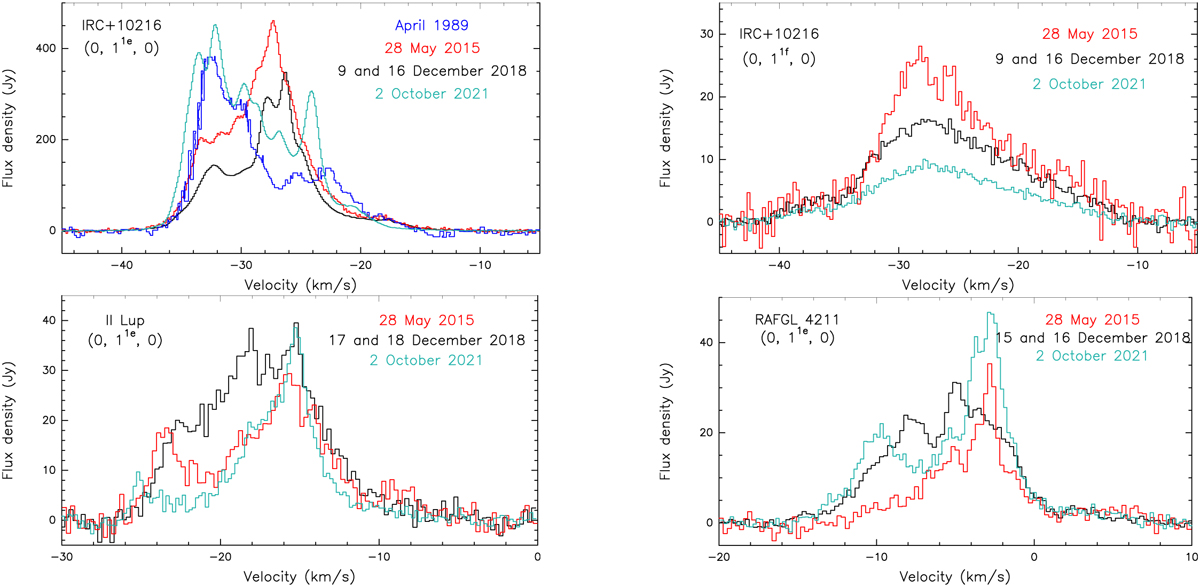
Fig. 7
Download original image
Variability of HCN (2−1) masers seen towards IRC+10216 (top two panels) in (0, lle, 0) and (0, llf, 0), II Lup (bottom left) and RAFGL 4211 (bottom right) in (0, lle, 0) vibrationally excited lines. The black spectra are from observations in 2018, cyan spectra are from 2021, red spectra are from Menten et al. (2018), and blue spectra are from Lucas & Cernicharo (1989) with the date of observations indicated in the legend.
Current usage metrics show cumulative count of Article Views (full-text article views including HTML views, PDF and ePub downloads, according to the available data) and Abstracts Views on Vision4Press platform.
Data correspond to usage on the plateform after 2015. The current usage metrics is available 48-96 hours after online publication and is updated daily on week days.
Initial download of the metrics may take a while.