Fig. 11
Download original image
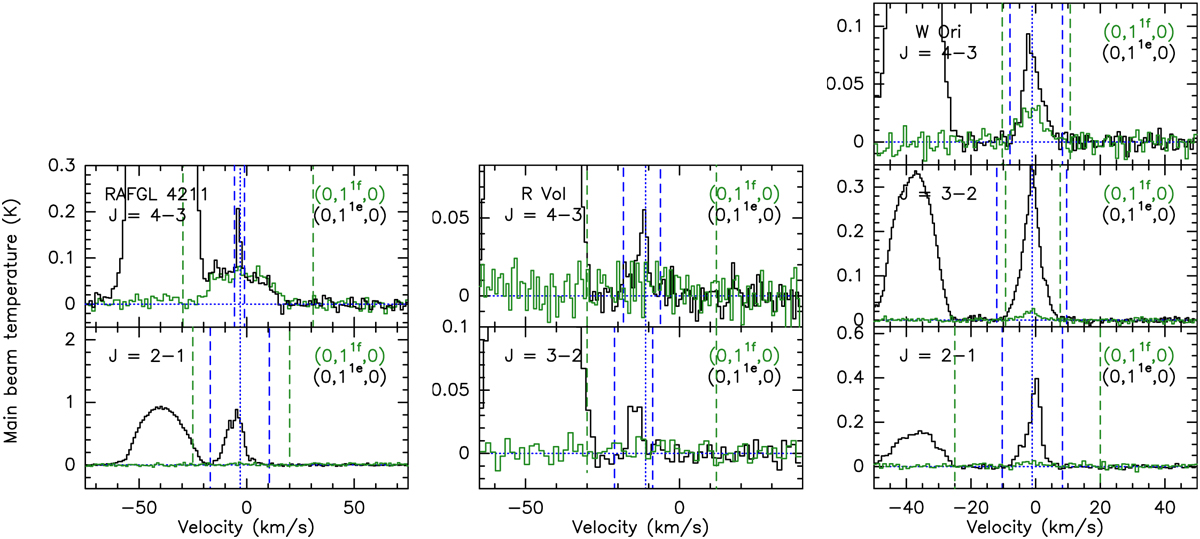
Overlaid spectra for HCN (0, 1le, 0) (in black) and (0, 1lf, 0) (in green) transitions in different rotational transitions towards RAFGL 4211 (left), R Vol (middle), and W Ori (right). These sources show brighter J = 4−3 (0, 1le, 0) emission than J = 4−3 (0, 1lf, 0). The vertical lines are labelled in the same way as for Fig. 1.
Current usage metrics show cumulative count of Article Views (full-text article views including HTML views, PDF and ePub downloads, according to the available data) and Abstracts Views on Vision4Press platform.
Data correspond to usage on the plateform after 2015. The current usage metrics is available 48-96 hours after online publication and is updated daily on week days.
Initial download of the metrics may take a while.