Fig. 1
Download original image
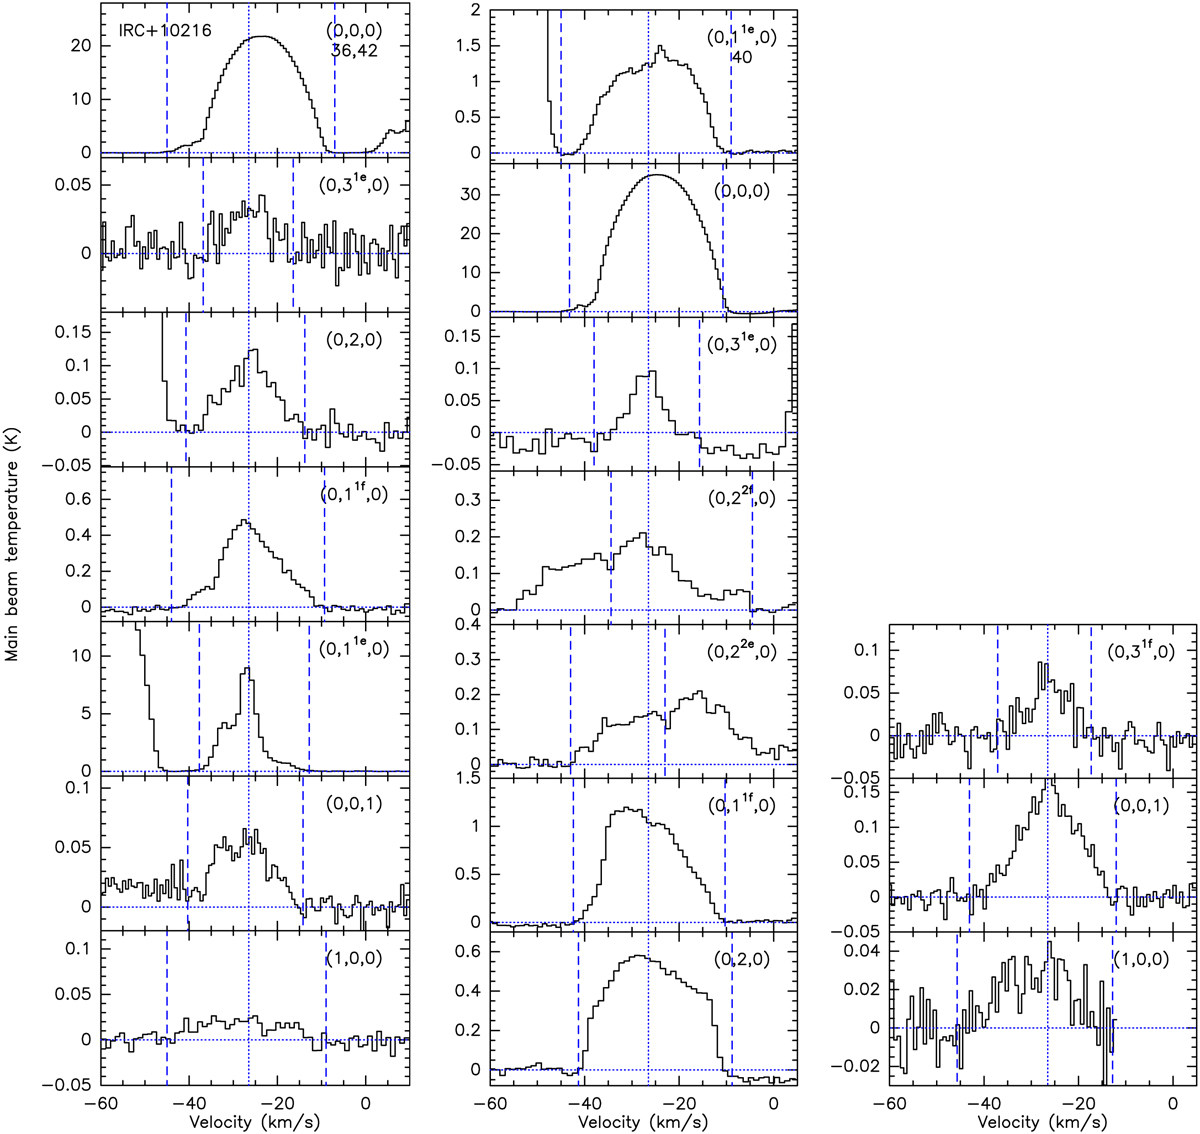
From left to right: Spectra for J = 2−1 (first) and 3−2 (second and third) transitions of HCN towards IRC +10216. The vibrational state of each transition is indicated in the top right corner of the respective spectrum. The vertical dashed blue lines denote the range of the emission in VLSR, the vertical dotted line shows the systemic VLSR of the star, and the horizontal dotted line is the baseline. The number below the vibrational quantum numbers in the panel is a code assigned to the date of observation of the particular transition. The corresponding dates of the codes are listed in the notes of Table 4.
Current usage metrics show cumulative count of Article Views (full-text article views including HTML views, PDF and ePub downloads, according to the available data) and Abstracts Views on Vision4Press platform.
Data correspond to usage on the plateform after 2015. The current usage metrics is available 48-96 hours after online publication and is updated daily on week days.
Initial download of the metrics may take a while.