Fig. 6.
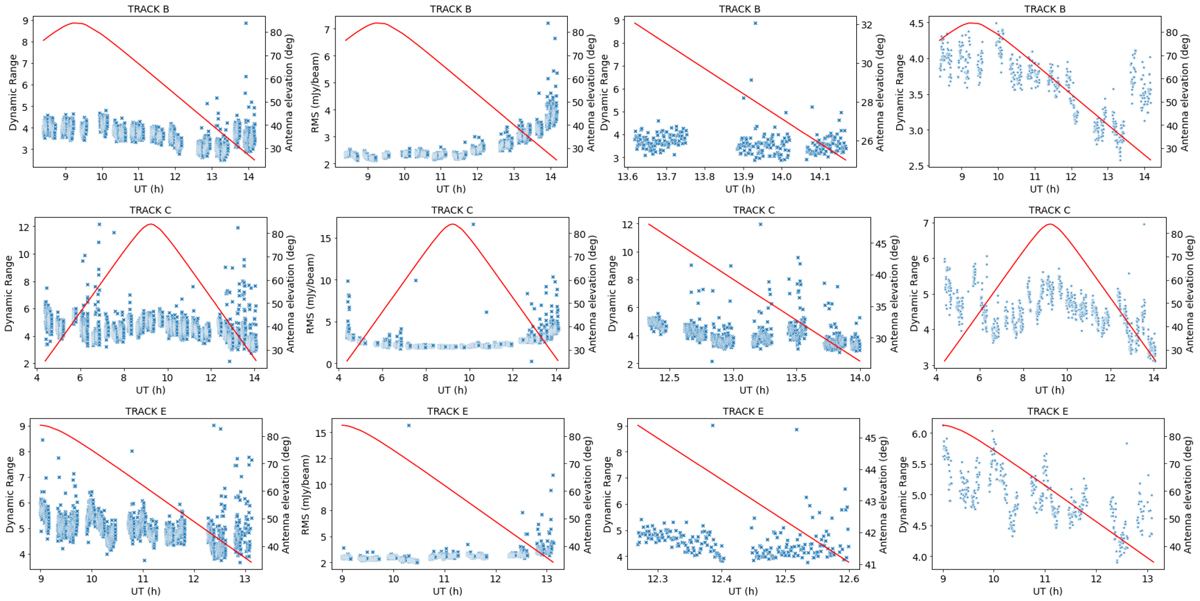
Download original image
Snapshot residual image statistics after the two-components’ self-calibration. Each row refers to one epoch (see Sect. 2 for details). Columns from left to right: dynamic range of the experiments (4 s cadence); rms of the experiments (4 s cadence); zoom to the area where more promising excursions have been detected using 4 s cadence; dynamic range (12 s cadence). In all panels, antenna elevations are shown in red.
Current usage metrics show cumulative count of Article Views (full-text article views including HTML views, PDF and ePub downloads, according to the available data) and Abstracts Views on Vision4Press platform.
Data correspond to usage on the plateform after 2015. The current usage metrics is available 48-96 hours after online publication and is updated daily on week days.
Initial download of the metrics may take a while.