Fig. 4.
Download original image
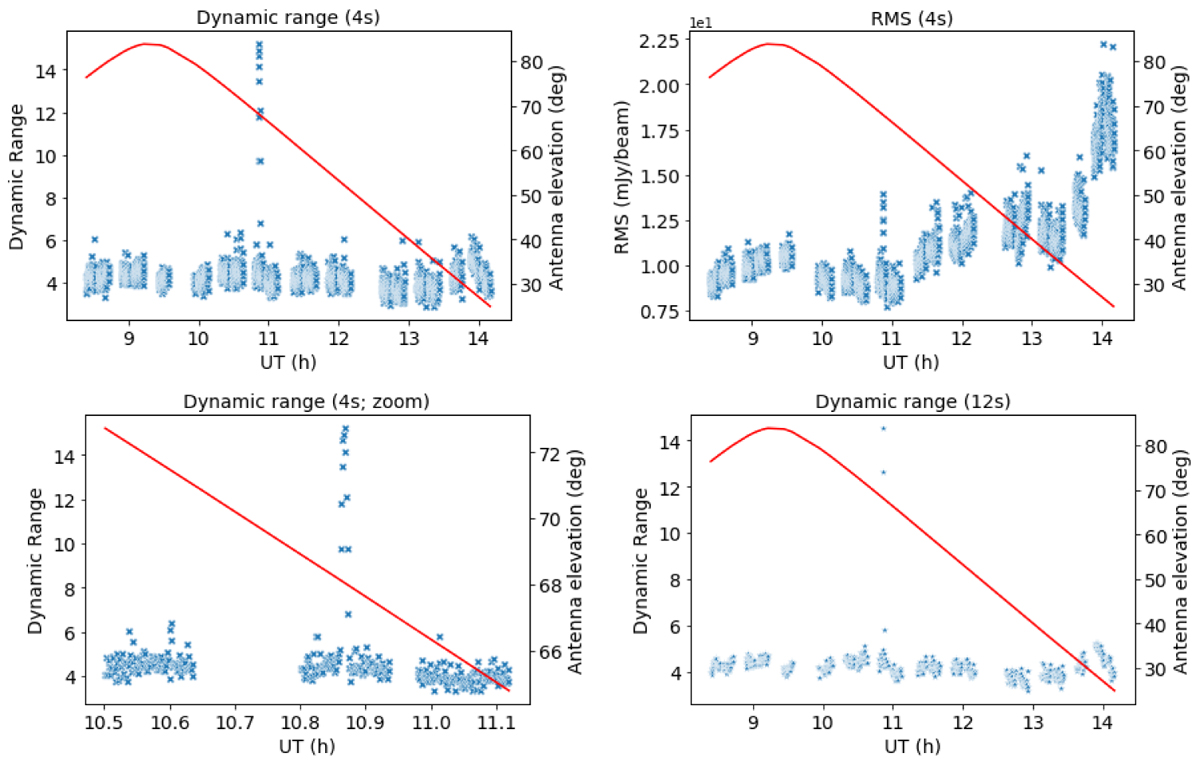
Snapshot image statistics for the synthetic dataset. Top left panel: time dependence of the dynamic range (with a 4 s cadence). Bottom left panel: zoom to the UT range with the mock transient. Top right panel: RMS with a cadence of 4 s. Bottom right panel: dynamic range using a cadence of 12 s. In all panels, antenna elevations are shown in red.
Current usage metrics show cumulative count of Article Views (full-text article views including HTML views, PDF and ePub downloads, according to the available data) and Abstracts Views on Vision4Press platform.
Data correspond to usage on the plateform after 2015. The current usage metrics is available 48-96 hours after online publication and is updated daily on week days.
Initial download of the metrics may take a while.