Open Access
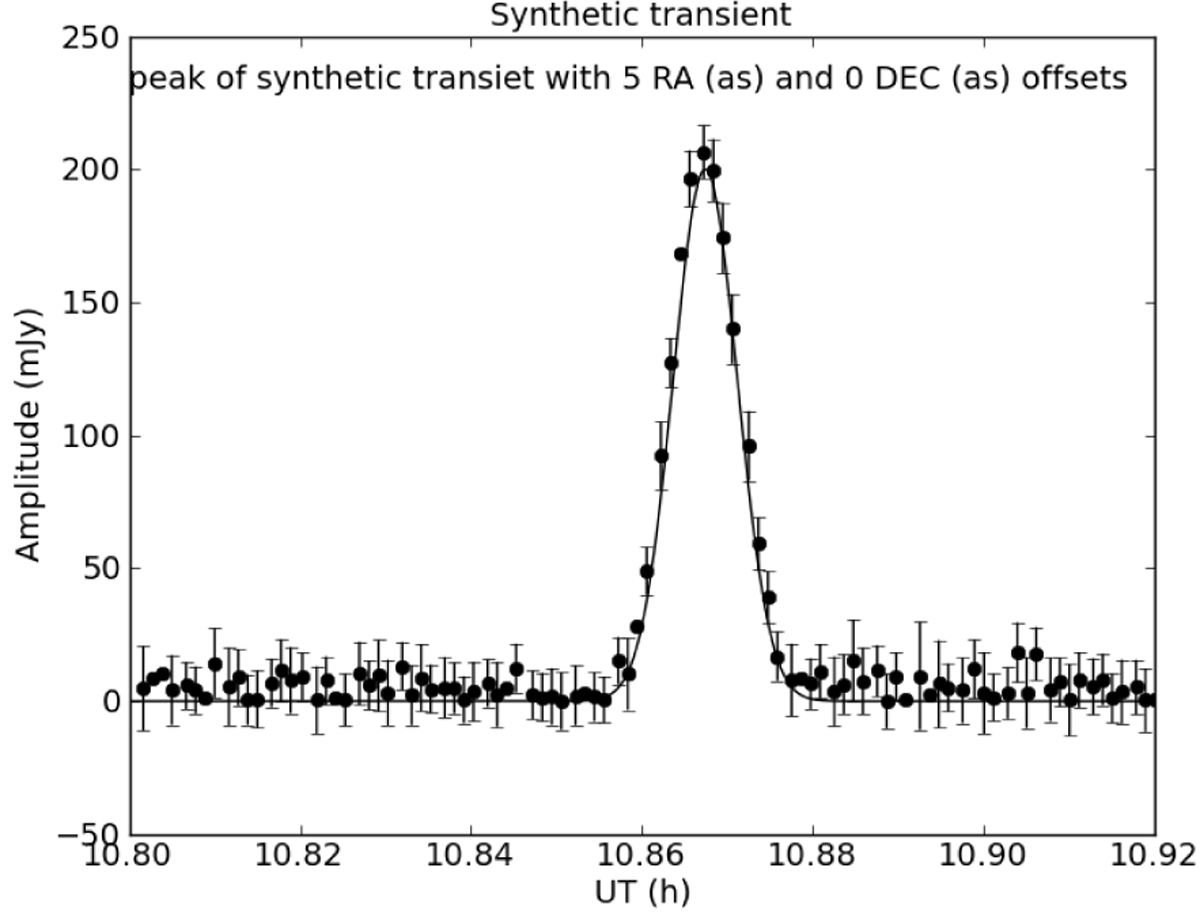
Fig. 3.
Download original image
Amplitude as a function of time for the simulated transient. Continuous line is the simulated transient flux density. Dots are the recovered amplitude of the transient, after applying our self-calibration algorithm. Error bars correspond to the instantaneous snapshot rms.
Current usage metrics show cumulative count of Article Views (full-text article views including HTML views, PDF and ePub downloads, according to the available data) and Abstracts Views on Vision4Press platform.
Data correspond to usage on the plateform after 2015. The current usage metrics is available 48-96 hours after online publication and is updated daily on week days.
Initial download of the metrics may take a while.