Fig. C.1.
Download original image
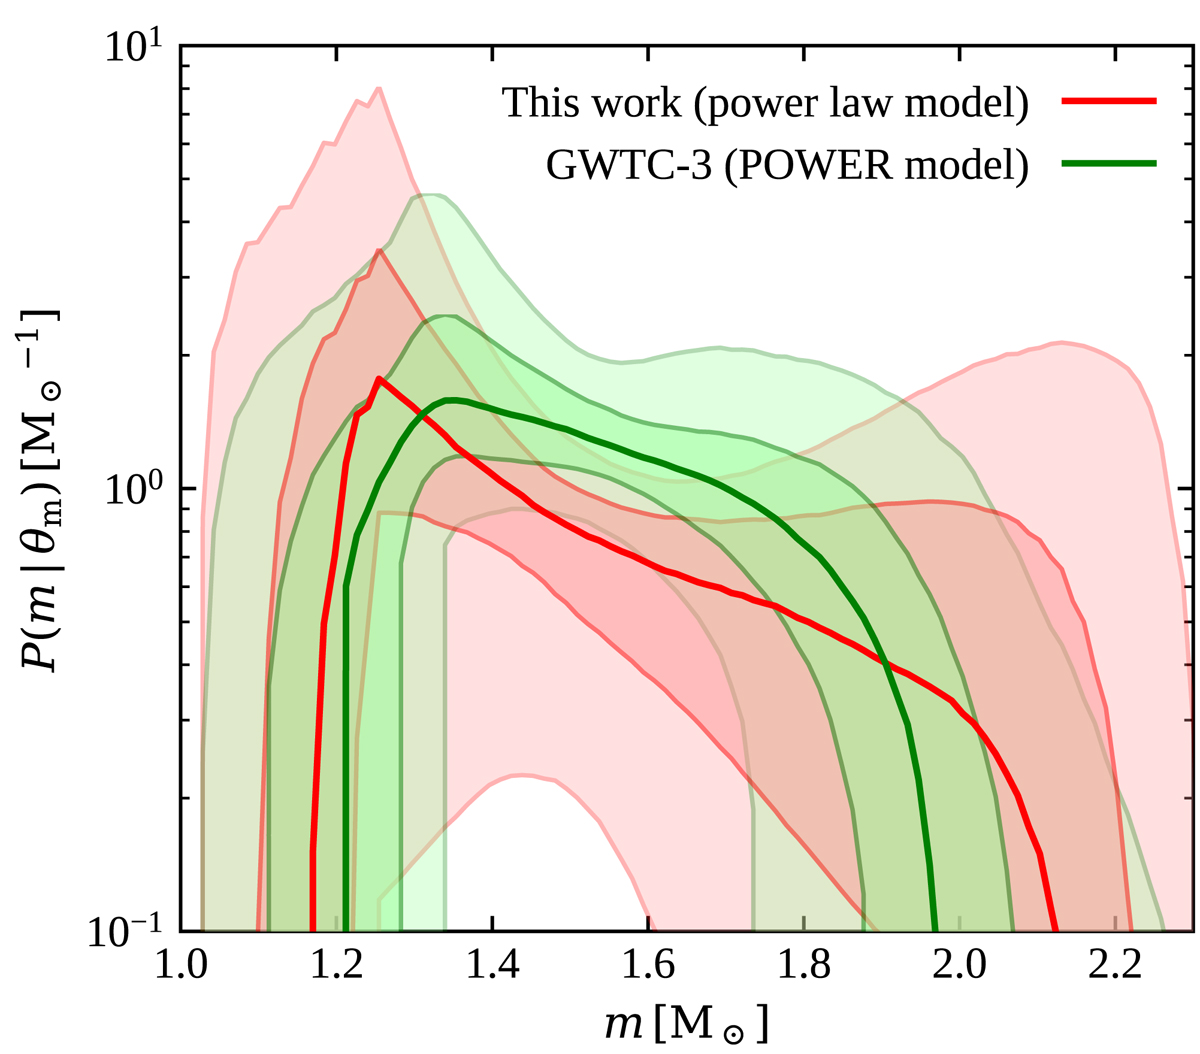
Comparison of our neutron star mass distribution posterior (power law model) with the GWTC-3 result from the population study described in Abbott et al. 2021a (their POWER model). Shaded areas show the 90% and 50% credible regions, while thick solid lines show the medians. Red is for our result (Sect. 4.2), blue is for the GWTC-3.
Current usage metrics show cumulative count of Article Views (full-text article views including HTML views, PDF and ePub downloads, according to the available data) and Abstracts Views on Vision4Press platform.
Data correspond to usage on the plateform after 2015. The current usage metrics is available 48-96 hours after online publication and is updated daily on week days.
Initial download of the metrics may take a while.