Open Access
Fig. A.2.
Download original image
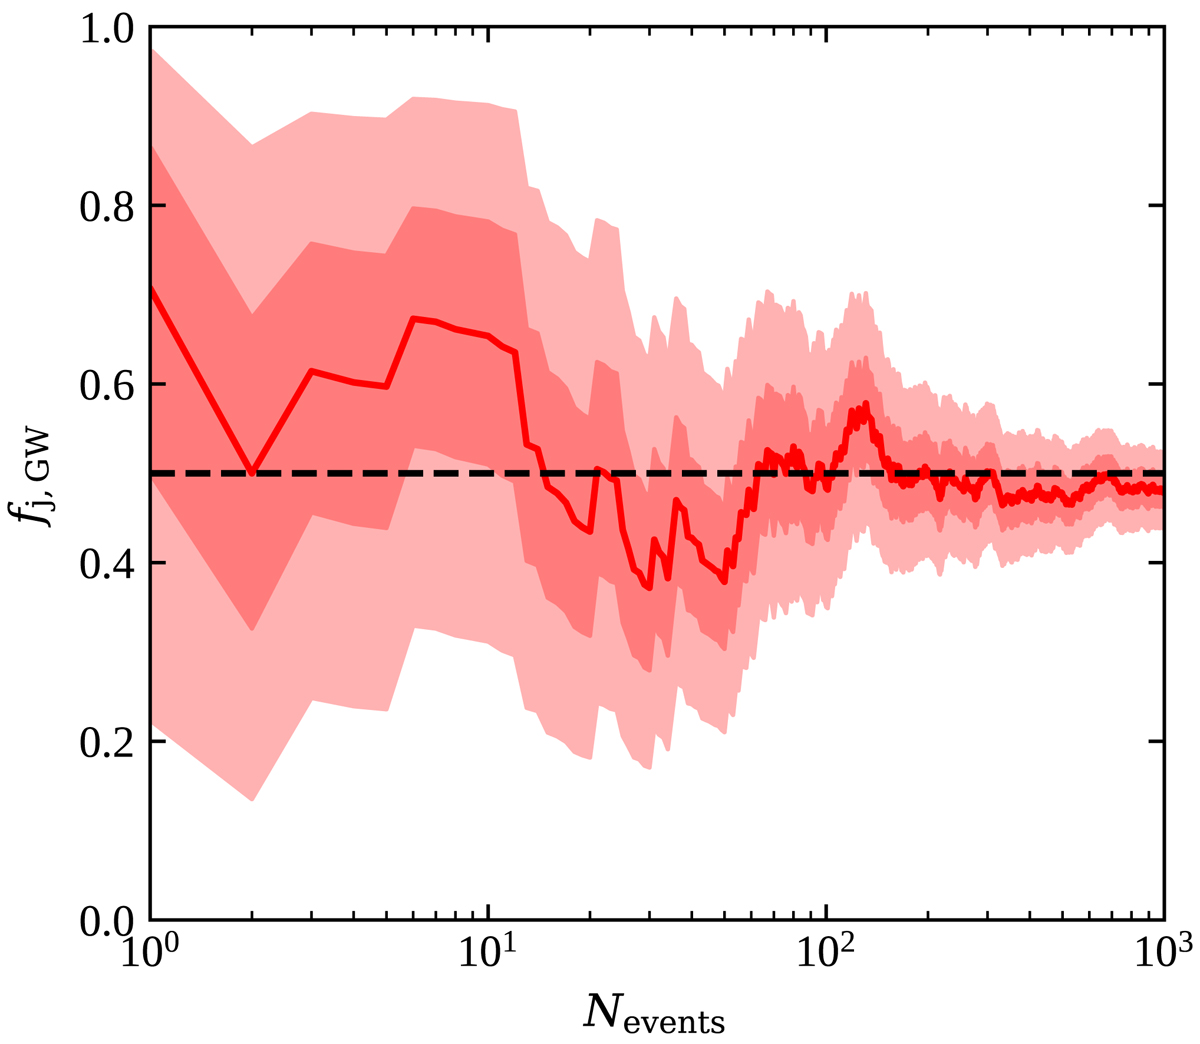
fj, GW inference with multiple GW-detected BNS mergers. The coloured bands show the evolution of the posterior 90% and 50% credible range on fj, GW after Nevents simulated GW detections (see text), while the red solid line shows the median of the posterior. The horizontal black dashed line shows the true value.
Current usage metrics show cumulative count of Article Views (full-text article views including HTML views, PDF and ePub downloads, according to the available data) and Abstracts Views on Vision4Press platform.
Data correspond to usage on the plateform after 2015. The current usage metrics is available 48-96 hours after online publication and is updated daily on week days.
Initial download of the metrics may take a while.