Fig. 10.
Download original image
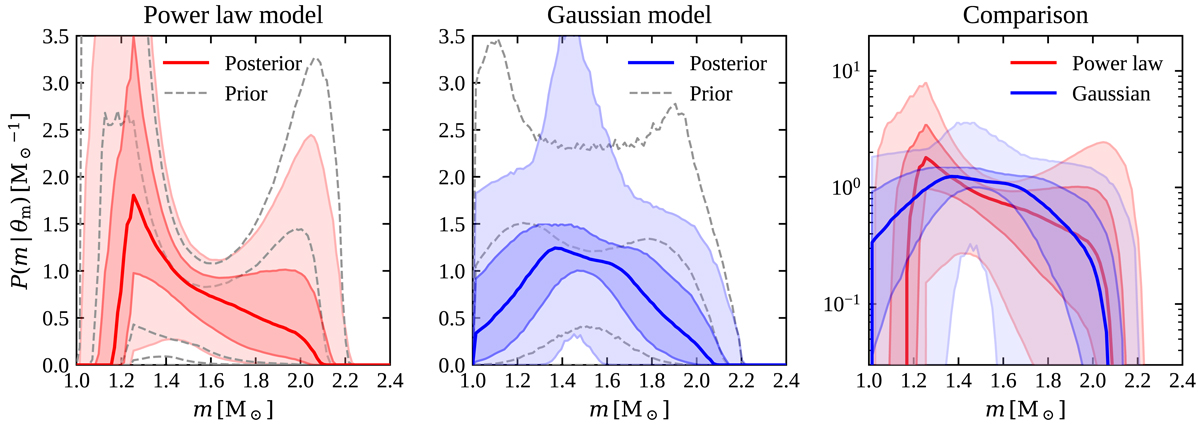
Mass distribution constraint. In each panel, filled contours show the 90% and 50% credible regions of the probability distribution P(m | θm) from which both M1 and M2 are sampled, while the thick solid line shows the median distribution at each m. The dj, GW constraint is used. Grey dashed lines show the edges of the corresponding 90% and 50% credible regions when using only the priors. Left-hand panel: the result for the power law mass distribution model, the central panel shows that for the Gaussian model, and the right-hand panel compares the two results with a log-scale vertical axis, to emphasise the lower 90% contour.
Current usage metrics show cumulative count of Article Views (full-text article views including HTML views, PDF and ePub downloads, according to the available data) and Abstracts Views on Vision4Press platform.
Data correspond to usage on the plateform after 2015. The current usage metrics is available 48-96 hours after online publication and is updated daily on week days.
Initial download of the metrics may take a while.