Fig. 9
Download original image
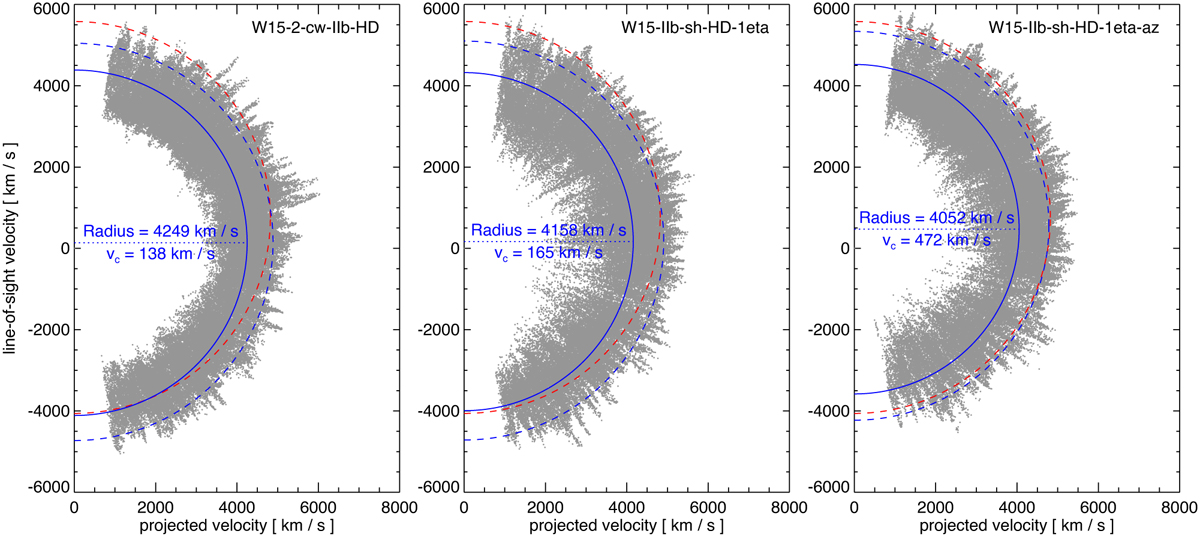
Projected (in the plane of the sky) and LoS velocities at the age of Cas A derived from models W15-2-cw-IIb-HD (left panel), W15-IIb-sh-HD-1eta (center panel) and W15-IIb-sh-HD-1eta-az (right panel). The solid blue line in each panel is the best-fit semicircle to the data from the models; the dashed blue line shows the semicircle but artificially scaling the velocities to match the value of vR inferred from Cas A observations; the dashed red line is the best-fit semicircle to actual data of Cas A derived by Milisavljevic & Fesen (2013).
Current usage metrics show cumulative count of Article Views (full-text article views including HTML views, PDF and ePub downloads, according to the available data) and Abstracts Views on Vision4Press platform.
Data correspond to usage on the plateform after 2015. The current usage metrics is available 48-96 hours after online publication and is updated daily on week days.
Initial download of the metrics may take a while.