Fig. 8
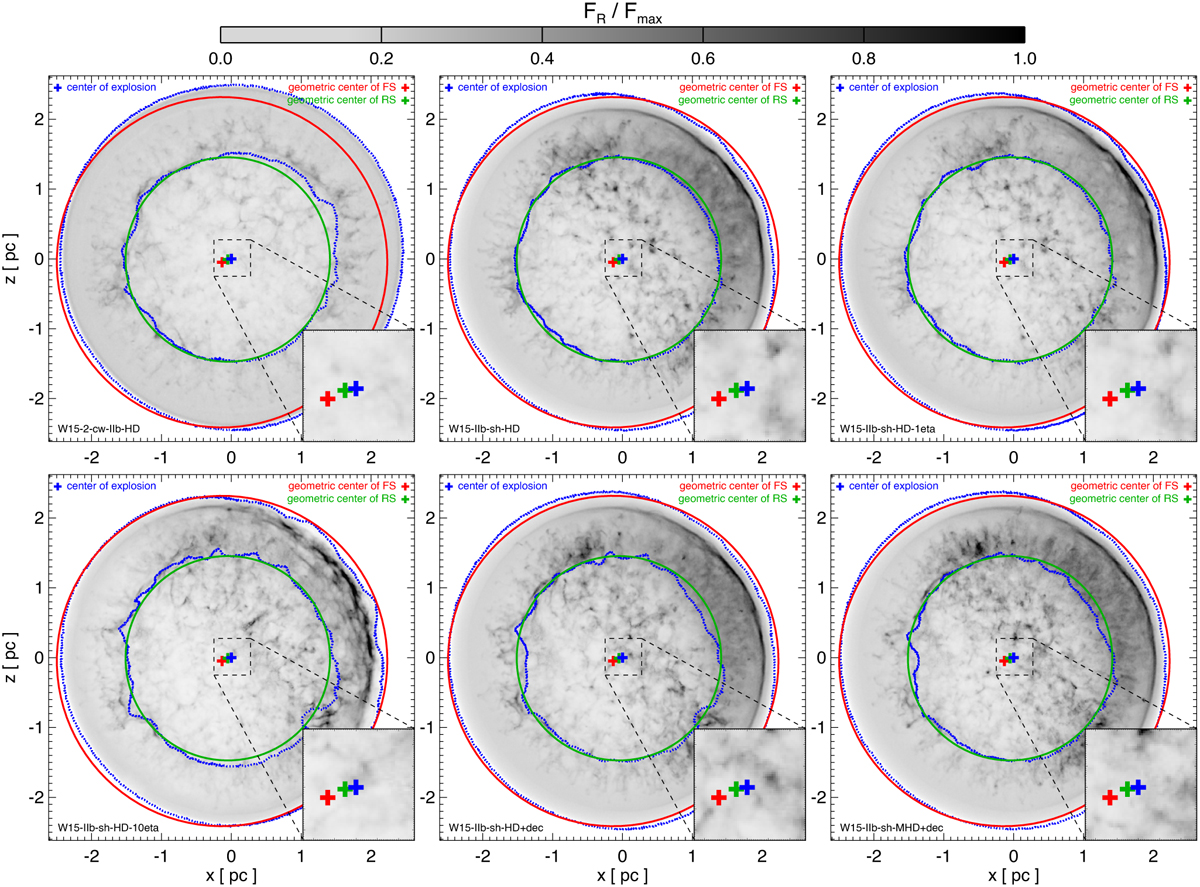
Download original image
Radio maps at the age of Cas A synthesized from the first six SNR models listed in Table 1, including model W15-2-cw-IIb-HD (presented in Paper I). The maps are normalized to the maximum radio flux, Fmax, in model W15-IIb-sh-HD-10eta. The blue dotted contours show cuts of the forward and reverse shocks in the plane of the sky passing through the center of the explosion (marked with a blue cross in each panel). The red and green circles mark the same cuts but for spheres roughly delineating the forward and reverse shocks, respectively, in models describing the remnant-shell interaction (the circles are the same in all the panels); the center of these spheres are marked with a cross of the same color (red or green) in each panel. These crosses represent the geometric center of the forward and reverse shocks, respectively, offset to the SE from the center of the explosion. The inset in the lower right corner of each panel is a zoom of the center of the domain.
Current usage metrics show cumulative count of Article Views (full-text article views including HTML views, PDF and ePub downloads, according to the available data) and Abstracts Views on Vision4Press platform.
Data correspond to usage on the plateform after 2015. The current usage metrics is available 48-96 hours after online publication and is updated daily on week days.
Initial download of the metrics may take a while.