Fig. 5
Download original image
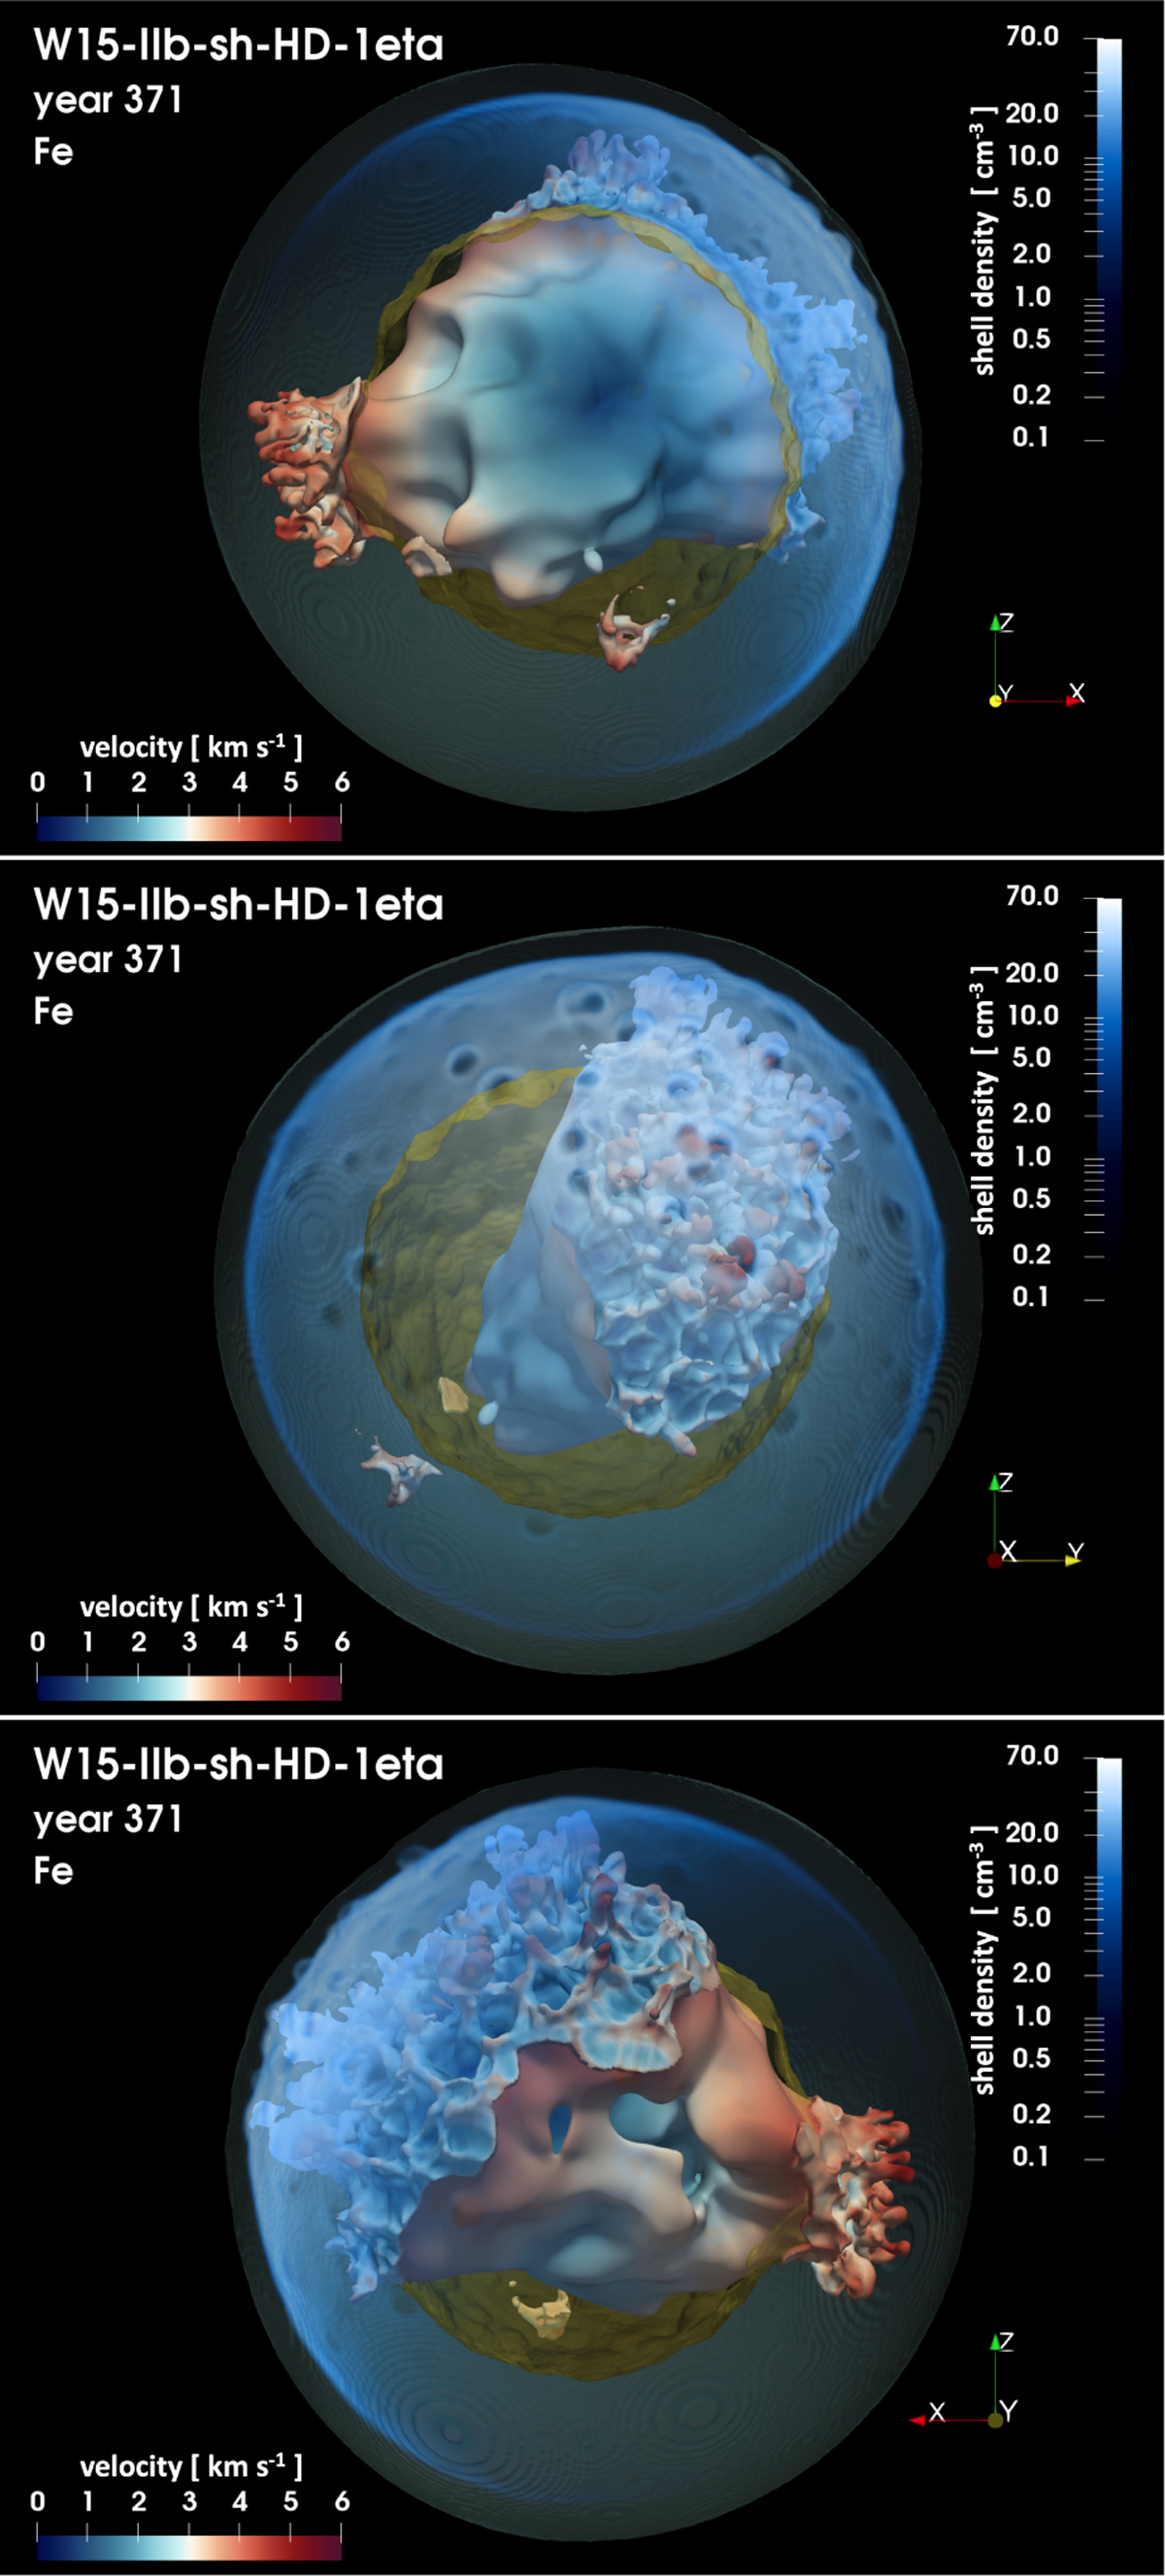
Isosurface of the distribution of Fe (corresponding to a value of Fe density which is at 5% of the peak density) at the age of Cas A for different viewing angles for model W15-IIb-sh-HD-leta; the colors give the radial velocity in units of 1000 km s−1 on the isosurface (color coding defined at the bottom of each panel). The semi-transparent clipped quasi-spherical surfaces indicate the forward (green) and reverse (yellow) shocks. The shocked shell is visualized through a volume rendering that uses the blue color palette (color coding on the right of each panel); the opacity is proportional to the plasma density. A navigable 3D graphic of this model is available at https://skfb.ly/o8FnO.
Current usage metrics show cumulative count of Article Views (full-text article views including HTML views, PDF and ePub downloads, according to the available data) and Abstracts Views on Vision4Press platform.
Data correspond to usage on the plateform after 2015. The current usage metrics is available 48-96 hours after online publication and is updated daily on week days.
Initial download of the metrics may take a while.