Fig. 9.
Download original image
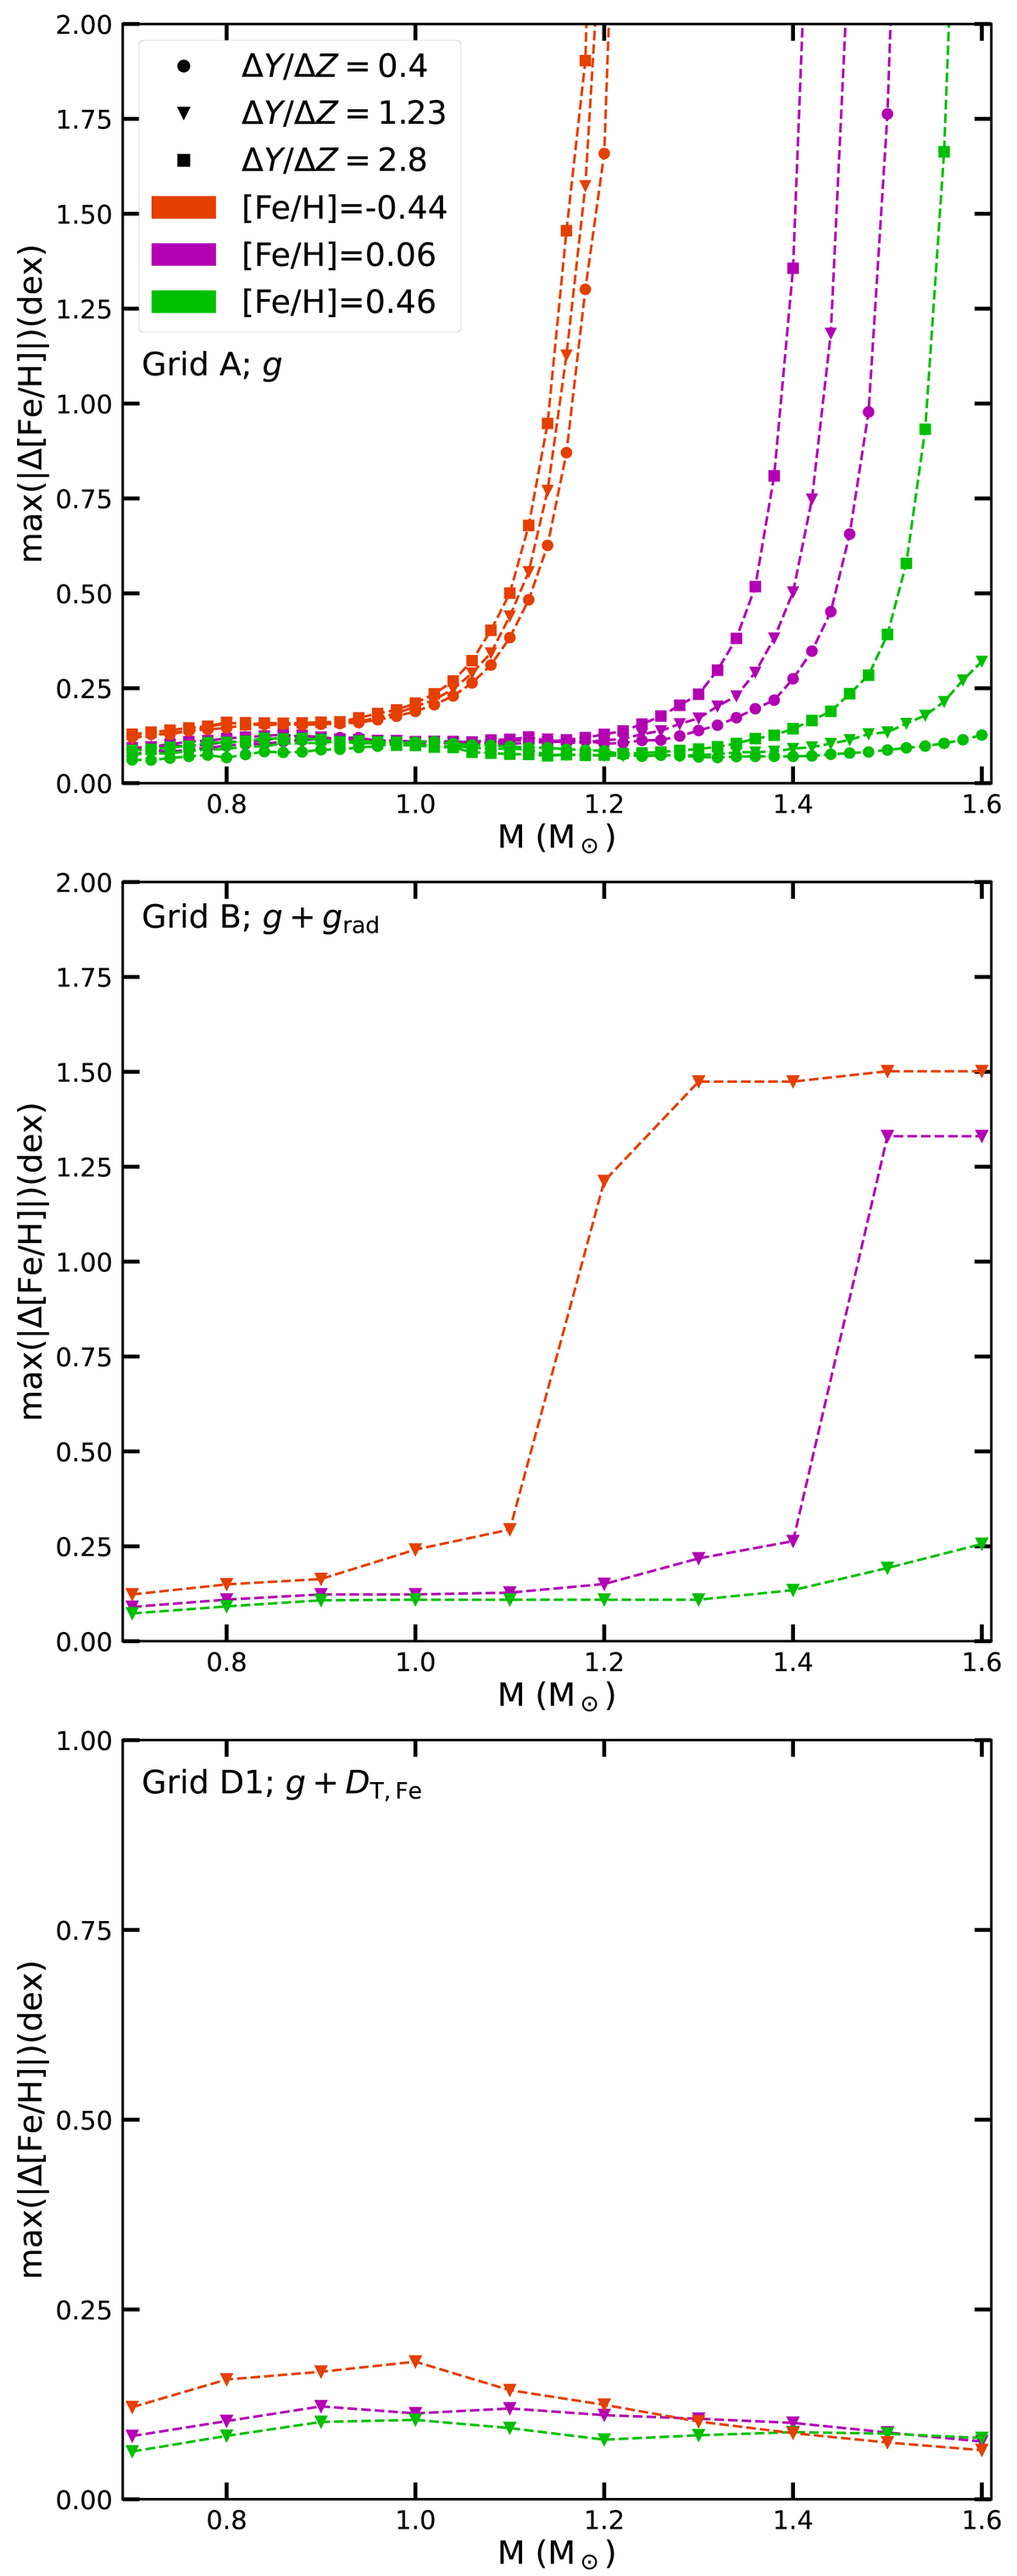
Maximum variation in [Fe/H] during the evolution (up to the tip of RGB) according to mass. The colours and symbols correspond to the values of [Fe/H]i and ΔY/ΔZ. The maximum variation was determined for ages less that 13.5 Gyr for the models that evolve on longer timescales (M ≲ 0.95). Top panel: includes atomic diffusion without radiative accelerations, the middle panel shows models that include radiative acceleration, and the bottom panel shows DT, Fe models.
Current usage metrics show cumulative count of Article Views (full-text article views including HTML views, PDF and ePub downloads, according to the available data) and Abstracts Views on Vision4Press platform.
Data correspond to usage on the plateform after 2015. The current usage metrics is available 48-96 hours after online publication and is updated daily on week days.
Initial download of the metrics may take a while.