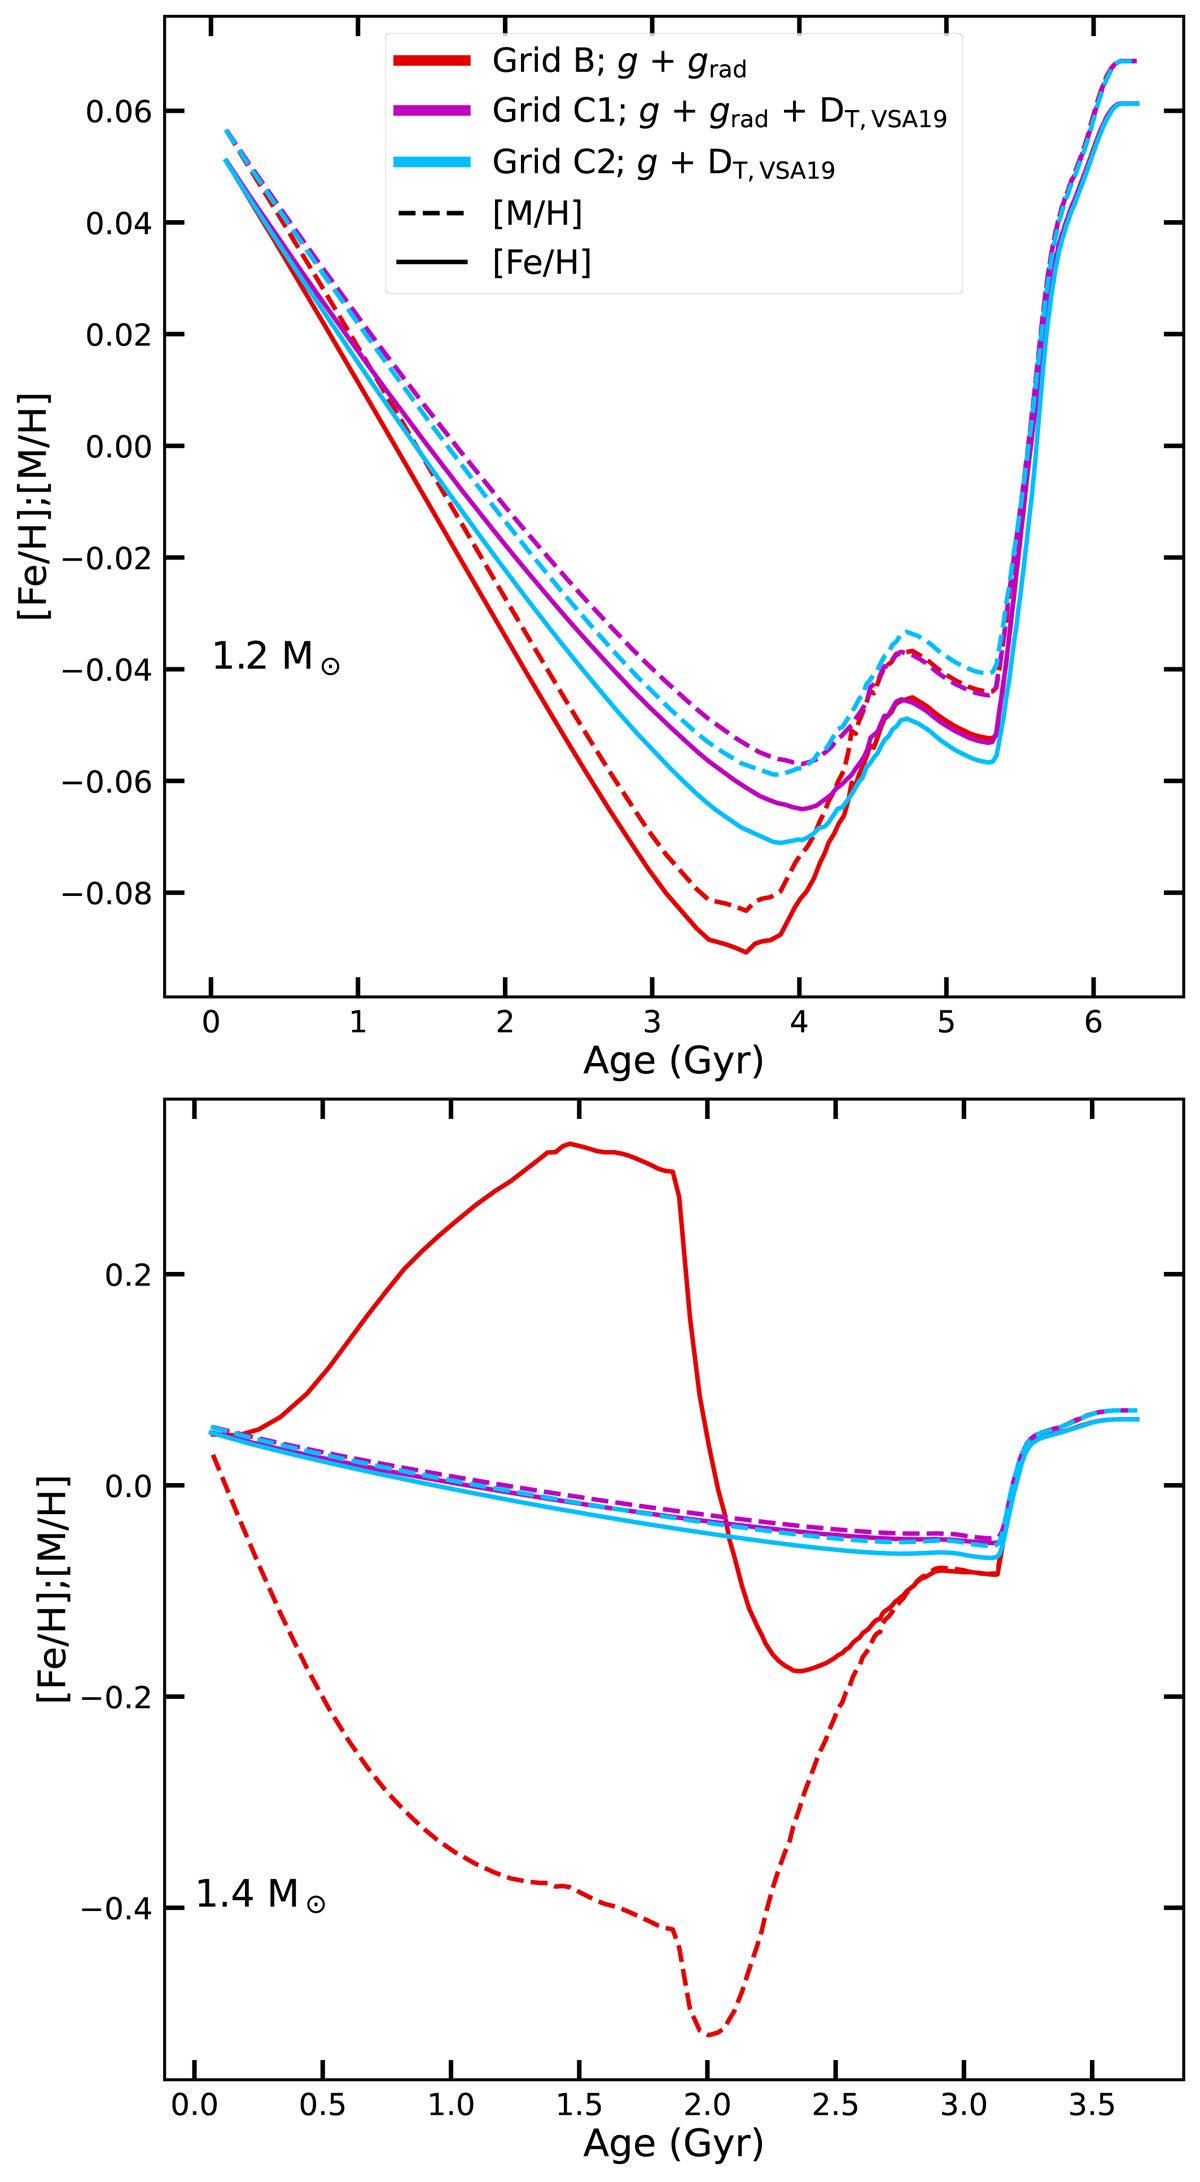
Fig. 4.
Download original image
Variation in [Fe/H] (solid lines) and [M/H] (dashed lines) from the ZAMS to the tip of the RGB for [Fe/H]i = 0.06. The purple and red lines represent models with and without turbulent mixing (both with radiative acceleration), and the cyan lines represent the model with only turbulent mixing. Top panel: is for the 1.2 M⊙ models and bottom panel: is for the 1.4 M⊙ models.
Current usage metrics show cumulative count of Article Views (full-text article views including HTML views, PDF and ePub downloads, according to the available data) and Abstracts Views on Vision4Press platform.
Data correspond to usage on the plateform after 2015. The current usage metrics is available 48-96 hours after online publication and is updated daily on week days.
Initial download of the metrics may take a while.