Open Access
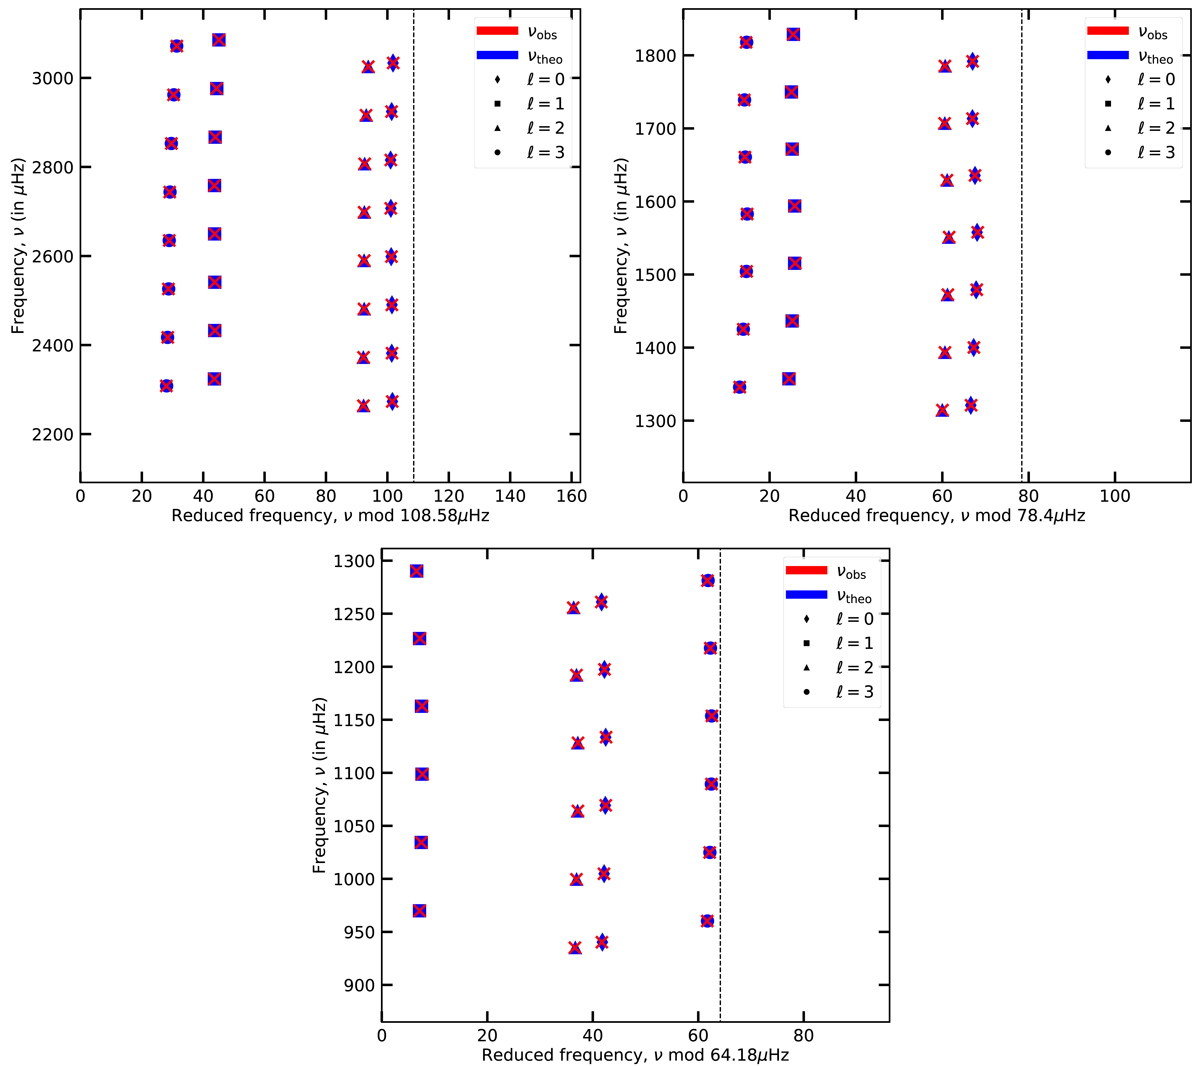
Fig. 10.
Download original image
Echelle diagram of the best optimisation result. Top panel: is for a star with 1.2 M⊙, the middle is for 1.4 M⊙, and the bottom is for 1.6 M⊙. νobs are the frequencies used as constraints from the optimised model from Grid D1; νtheo are the optimised frequencies from Grid C1.
Current usage metrics show cumulative count of Article Views (full-text article views including HTML views, PDF and ePub downloads, according to the available data) and Abstracts Views on Vision4Press platform.
Data correspond to usage on the plateform after 2015. The current usage metrics is available 48-96 hours after online publication and is updated daily on week days.
Initial download of the metrics may take a while.