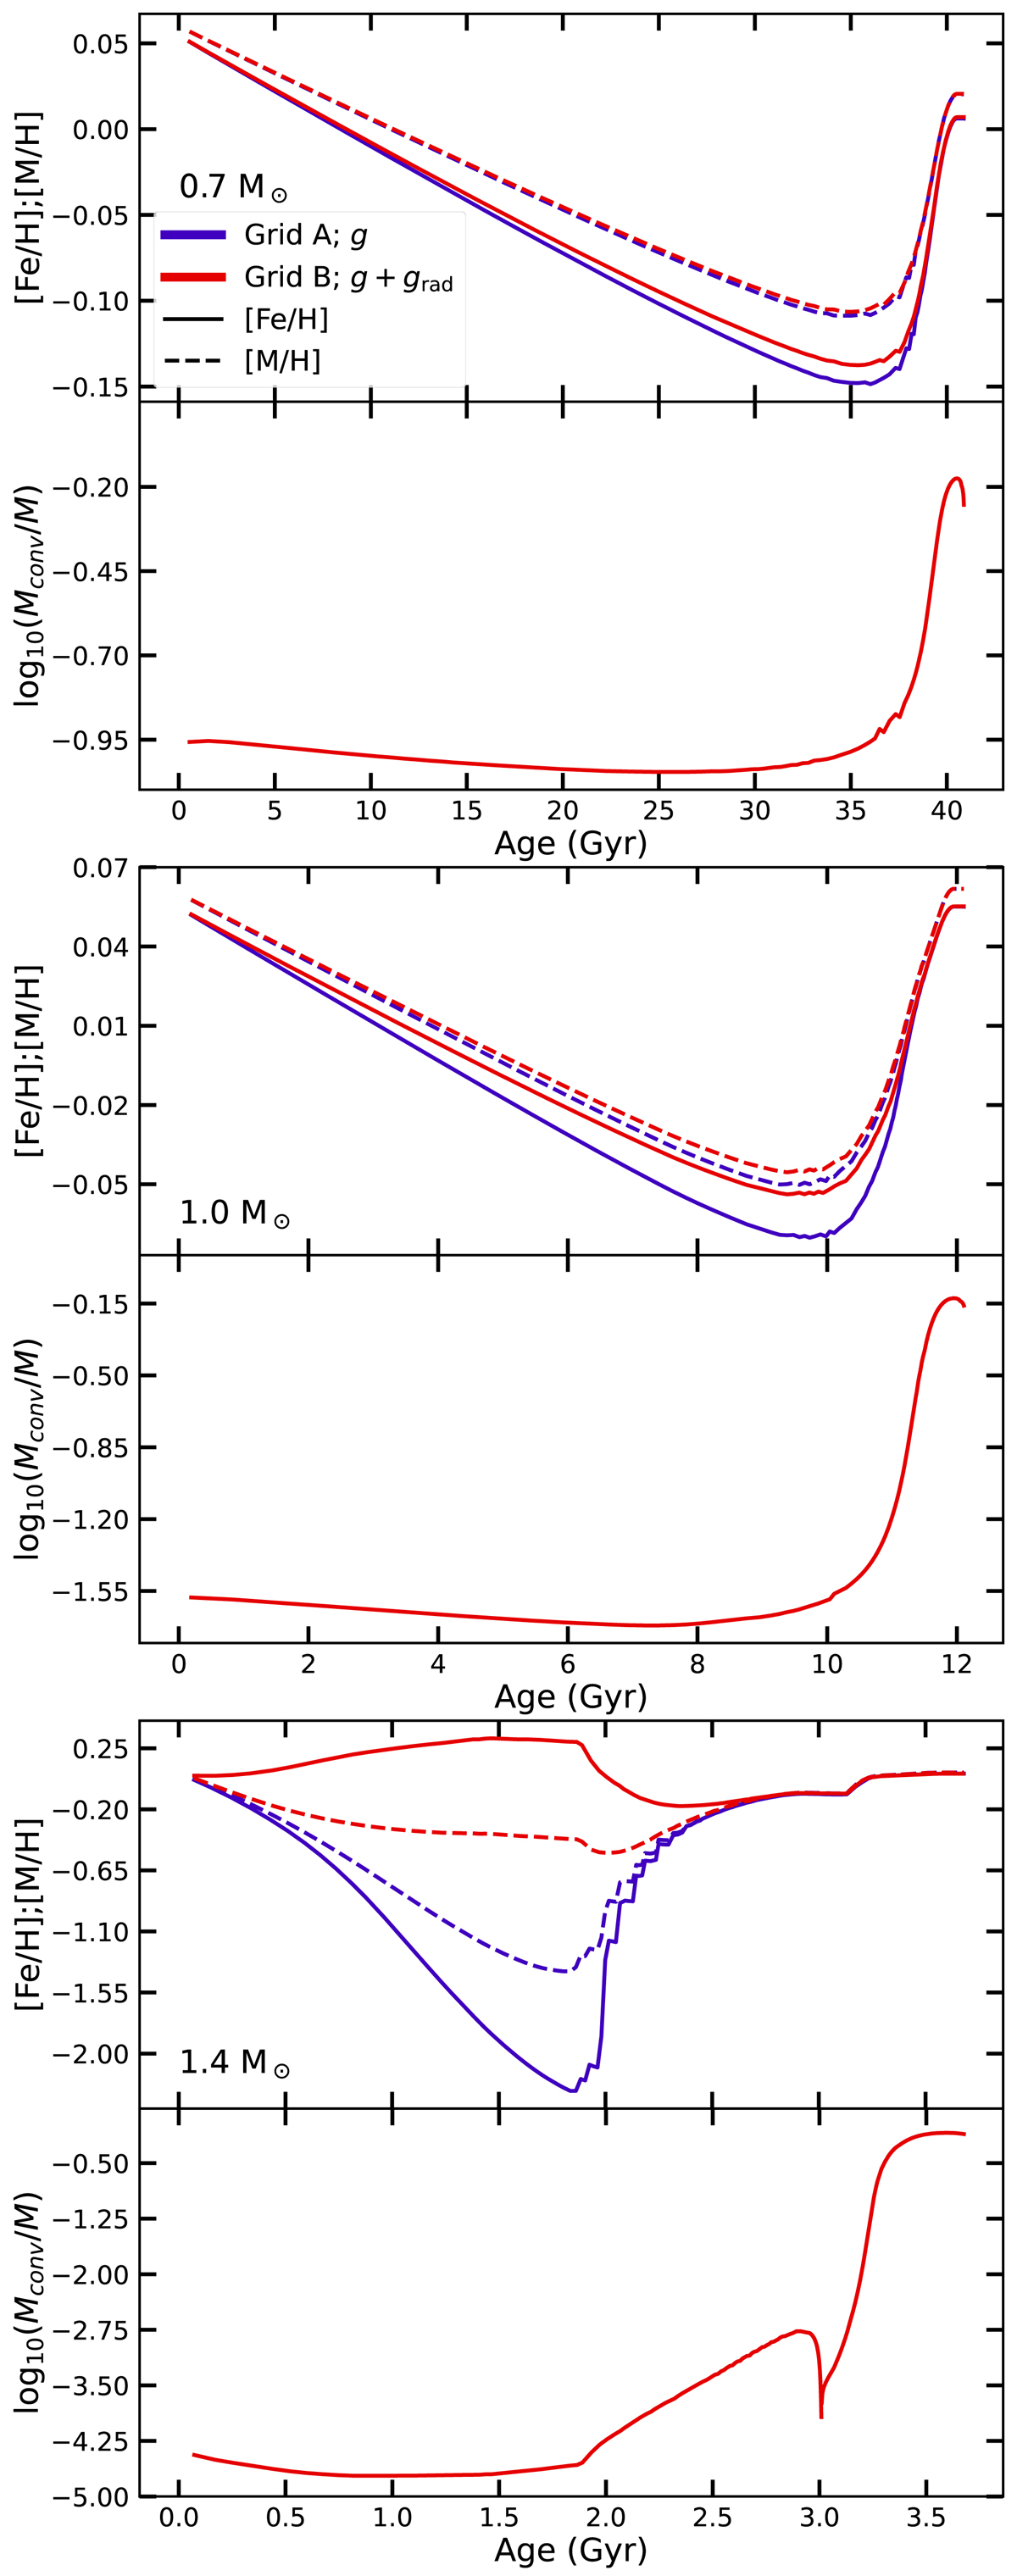
Fig. 1.
Download original image
Variation in [Fe/H] (solid lines, top of all subplots) and [M/H] (dashed lines, top of all subplots), and evolution of the convective envelope mass divided by the total mass of the model (bottom of all subplots) from the ZAMS to the tip of the RGB for [Fe/H]i = 0.06. The red and blue lines represent models with and without radiative acceleration. Top panels: are for 0.7 M⊙ models, middle panels: for 1.0 M⊙ models, and bottom panels: for 1.4 M⊙ models.
Current usage metrics show cumulative count of Article Views (full-text article views including HTML views, PDF and ePub downloads, according to the available data) and Abstracts Views on Vision4Press platform.
Data correspond to usage on the plateform after 2015. The current usage metrics is available 48-96 hours after online publication and is updated daily on week days.
Initial download of the metrics may take a while.