Open Access
Fig. 6.
Download original image
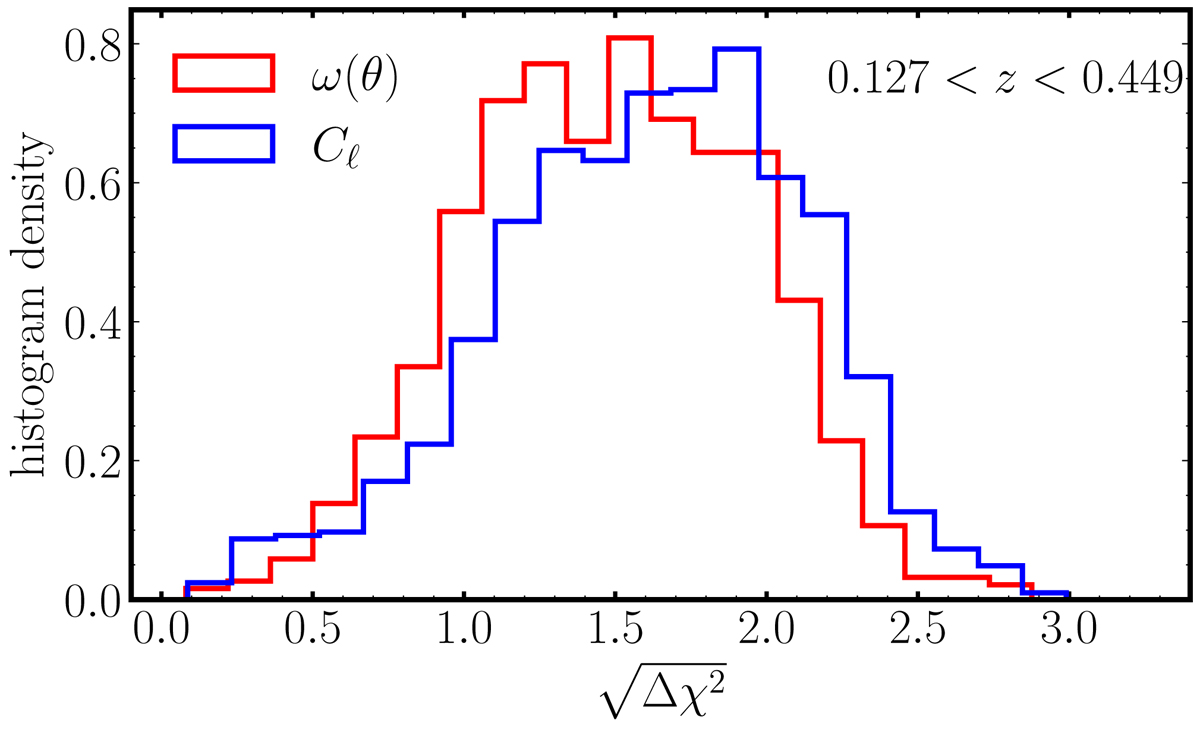
Histogram distribution of the significance, ![]() , of the BAO signal, in terms of number of σ, estimated for each of the FLASK simulations (i.e., the corresponding Ns fraction of mocks) considering each clustering estimator. These results are obtained by evaluating the BINGO-like simulations combining all the 30 z-bins.
, of the BAO signal, in terms of number of σ, estimated for each of the FLASK simulations (i.e., the corresponding Ns fraction of mocks) considering each clustering estimator. These results are obtained by evaluating the BINGO-like simulations combining all the 30 z-bins.
Current usage metrics show cumulative count of Article Views (full-text article views including HTML views, PDF and ePub downloads, according to the available data) and Abstracts Views on Vision4Press platform.
Data correspond to usage on the plateform after 2015. The current usage metrics is available 48-96 hours after online publication and is updated daily on week days.
Initial download of the metrics may take a while.