Fig. 5.
Download original image
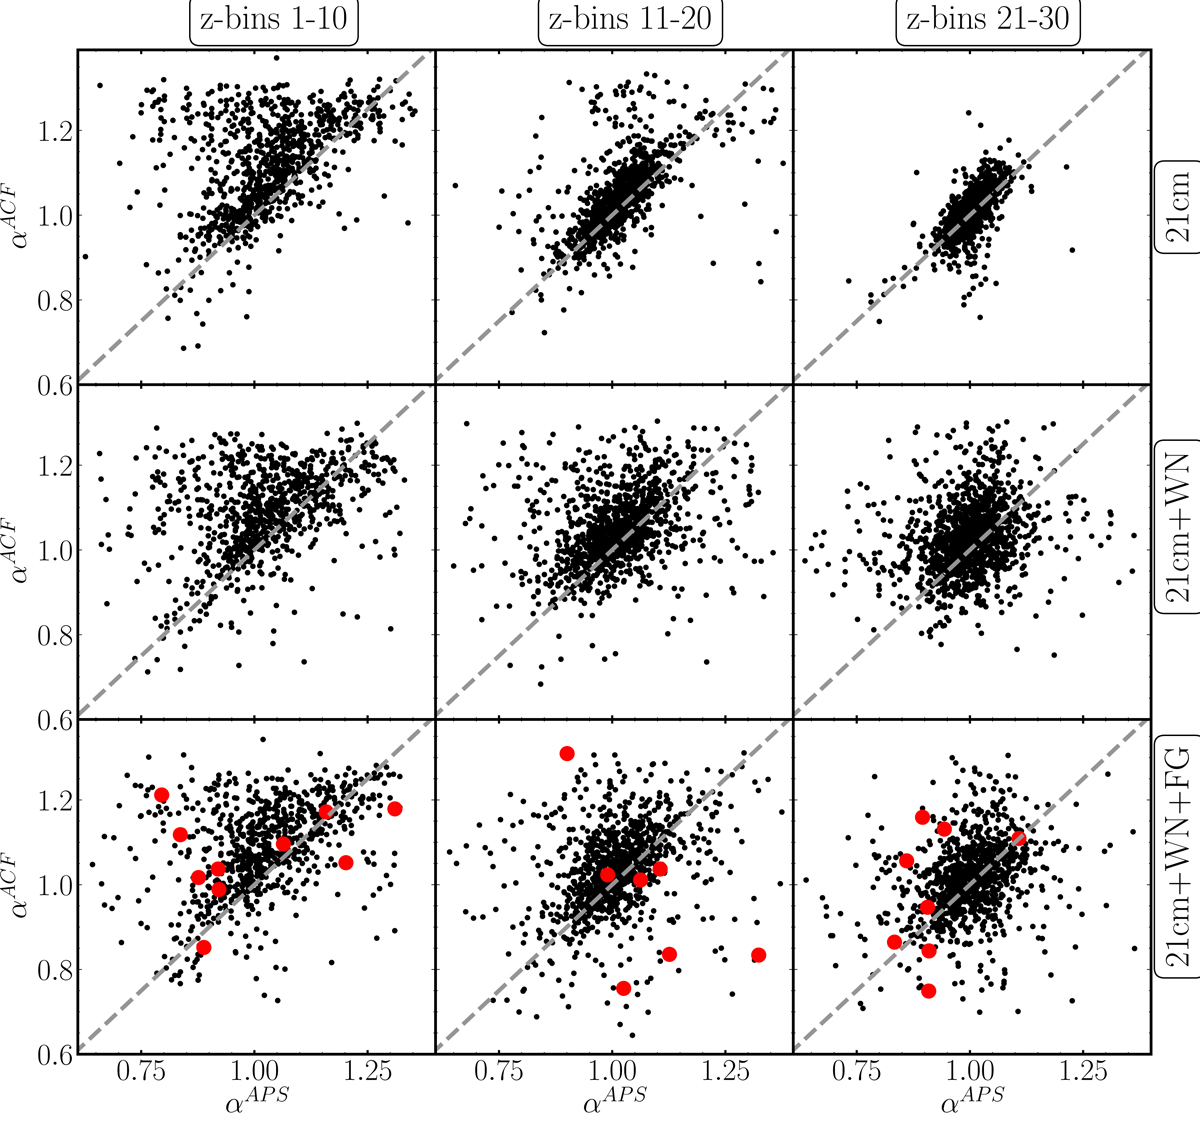
Comparison of the α values estimated using the ACF and APS estimators (black dots). The columns from left to right show estimates from lower to higher redshift ranges, with average ⟨z⟩ = 0.172, ⟨z⟩ = 0.270, and ⟨z⟩ = 0.386. The first row shows results for the 21 cm only analyses, and the middle and bottom rows show results including white noise only and white noise + foreground residual, respectively. The red dots in the bottom row show α estimates from the reconstructed (foreground cleaned) maps.
Current usage metrics show cumulative count of Article Views (full-text article views including HTML views, PDF and ePub downloads, according to the available data) and Abstracts Views on Vision4Press platform.
Data correspond to usage on the plateform after 2015. The current usage metrics is available 48-96 hours after online publication and is updated daily on week days.
Initial download of the metrics may take a while.