Fig. 2.
Download original image
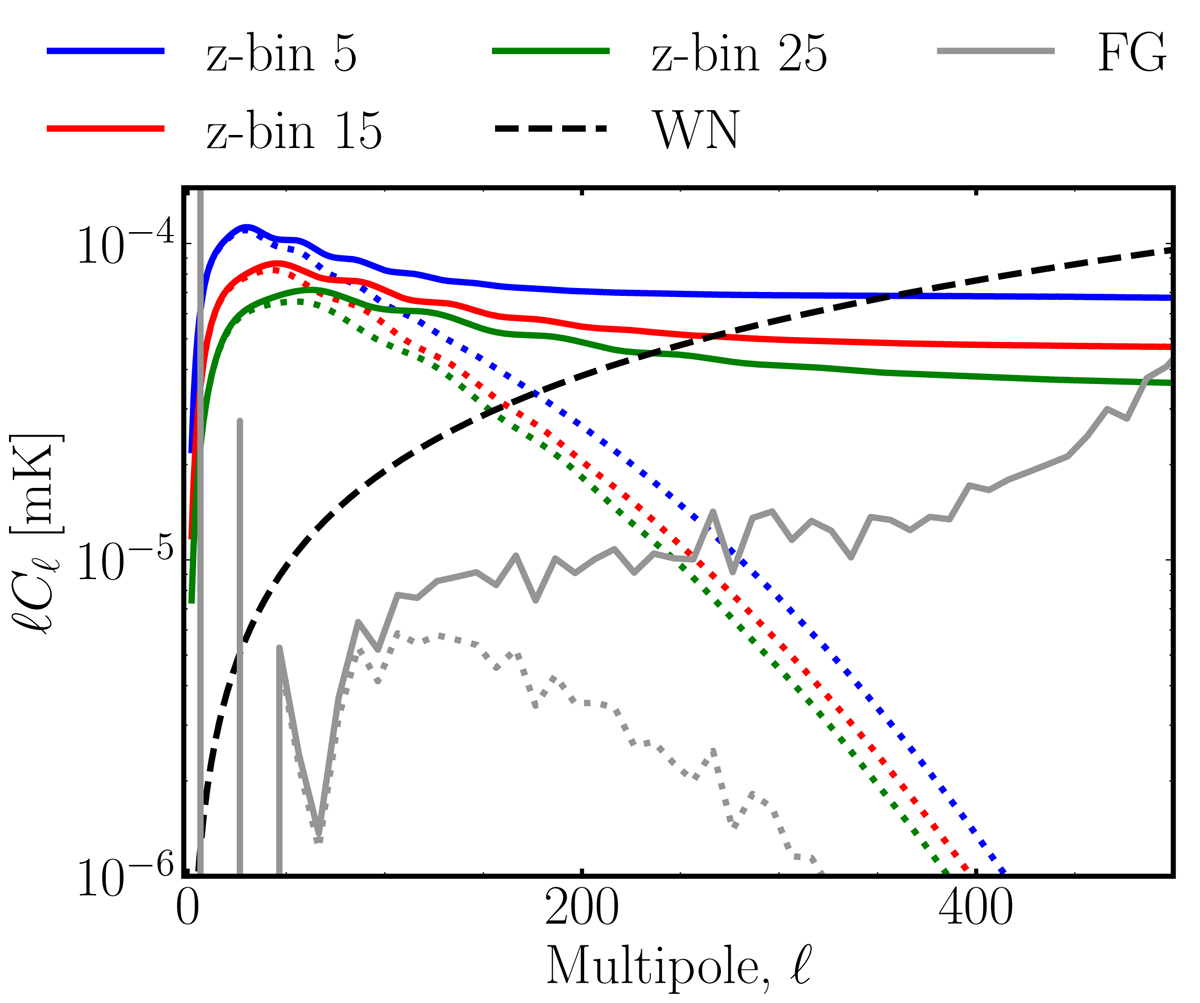
Theoretical APS calculated for three of the 30 tomographic bins linearly spaced in frequency, whose average redshifts are ![]() ,
, ![]() , and
, and ![]() . The BAO wiggles appear at higher multipoles as the redshift increases. The dashed black line shows the white noise amplitude. The expected contribution from foreground residuals at the highest z-bin (
. The BAO wiggles appear at higher multipoles as the redshift increases. The dashed black line shows the white noise amplitude. The expected contribution from foreground residuals at the highest z-bin (![]() ; the one with the highest amplitude of foreground residual) is represented by the gray line. The dotted lines show the effect introduced by the instrumental beam with θFWHM = 40′.
; the one with the highest amplitude of foreground residual) is represented by the gray line. The dotted lines show the effect introduced by the instrumental beam with θFWHM = 40′.
Current usage metrics show cumulative count of Article Views (full-text article views including HTML views, PDF and ePub downloads, according to the available data) and Abstracts Views on Vision4Press platform.
Data correspond to usage on the plateform after 2015. The current usage metrics is available 48-96 hours after online publication and is updated daily on week days.
Initial download of the metrics may take a while.