Fig. 1.
Download original image
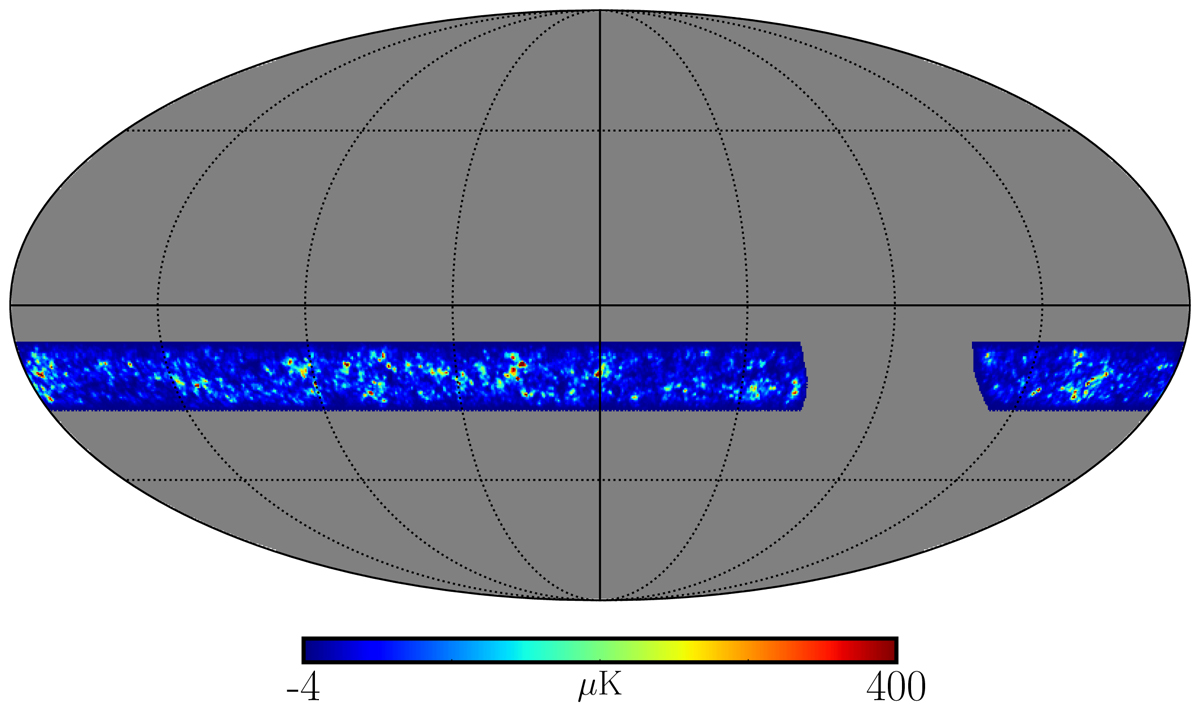
Illustrative example of a FLASK simulation at the lowest redshift bin (0.127 < z < 0.138), convolved with a Gaussian beam of θFWHM = 40 arcmin, after selecting the sky region (apodized mask) considered in all the analyses. The color indicates the brightness temperature in μK. The Mollweide projection corresponds to celestial coordinates.
Current usage metrics show cumulative count of Article Views (full-text article views including HTML views, PDF and ePub downloads, according to the available data) and Abstracts Views on Vision4Press platform.
Data correspond to usage on the plateform after 2015. The current usage metrics is available 48-96 hours after online publication and is updated daily on week days.
Initial download of the metrics may take a while.