Fig. B.1
Download original image
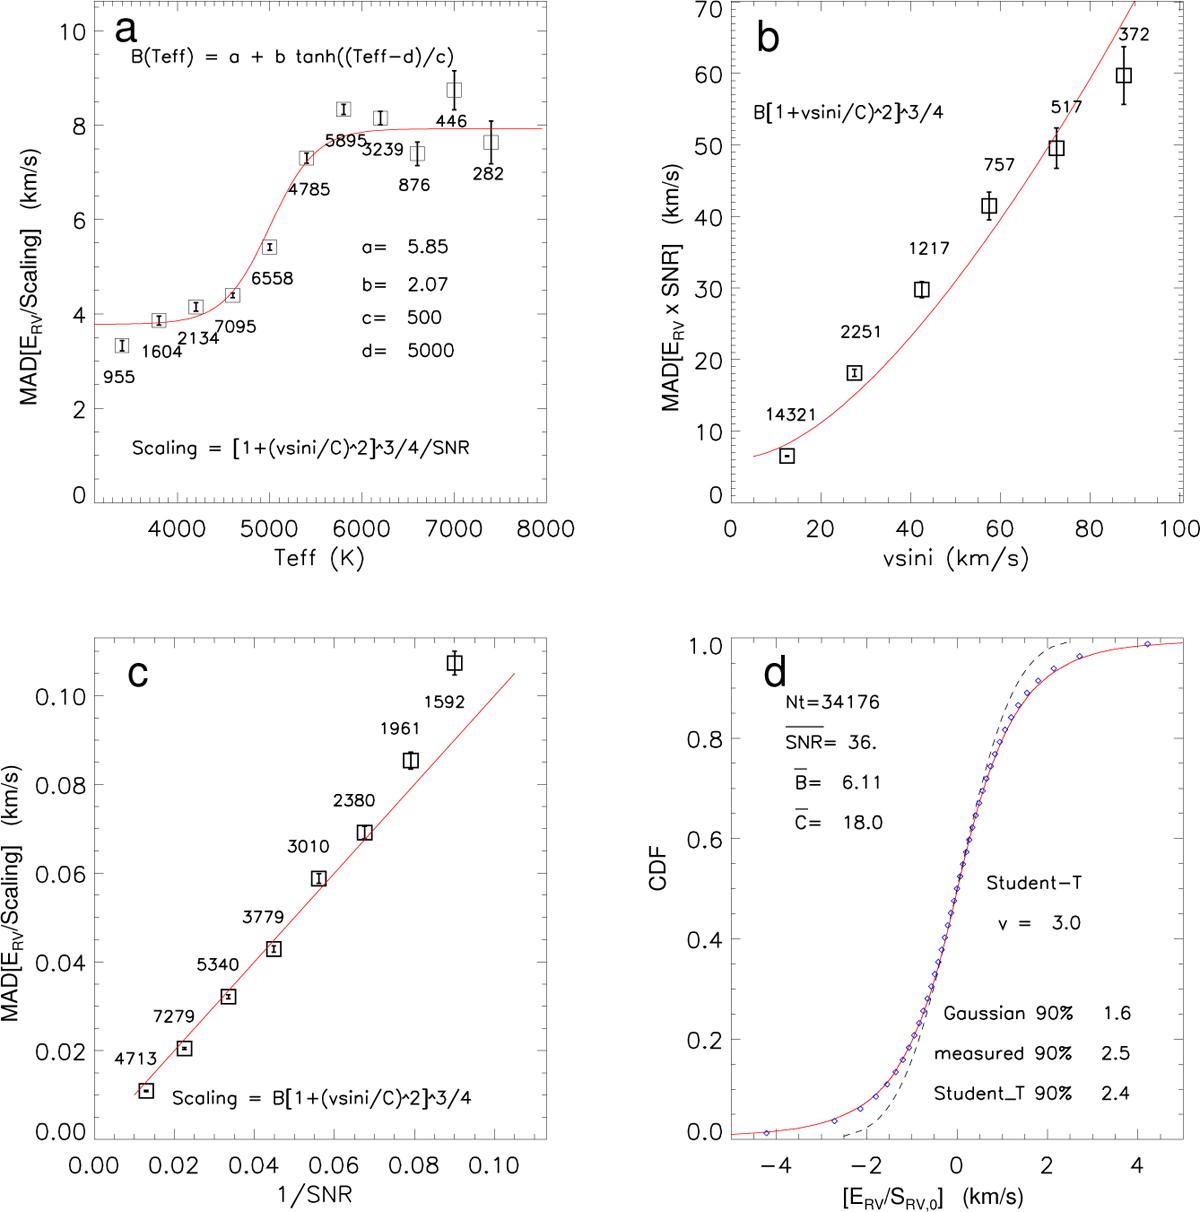
Fitting empirical parameters describing short-term repeats of RV to GES iDR6 data (see Eq. B.1). Plot (a) shows the variation in parameter B with target Teff. Plot (b) shows the variation in SRV,0 with υ sin i, and plot (c) shows the variation with SNR. Plot (d) compares the cumulative distribution of the normalised measurement uncertainty for short term repeats ERV/SRV,0 (red line) with a unit Gaussian distribution (dashed line) and a ν = 3 Student's t-distribution (blue circles).
Current usage metrics show cumulative count of Article Views (full-text article views including HTML views, PDF and ePub downloads, according to the available data) and Abstracts Views on Vision4Press platform.
Data correspond to usage on the plateform after 2015. The current usage metrics is available 48-96 hours after online publication and is updated daily on week days.
Initial download of the metrics may take a while.