Free Access
Fig. 17
Download original image
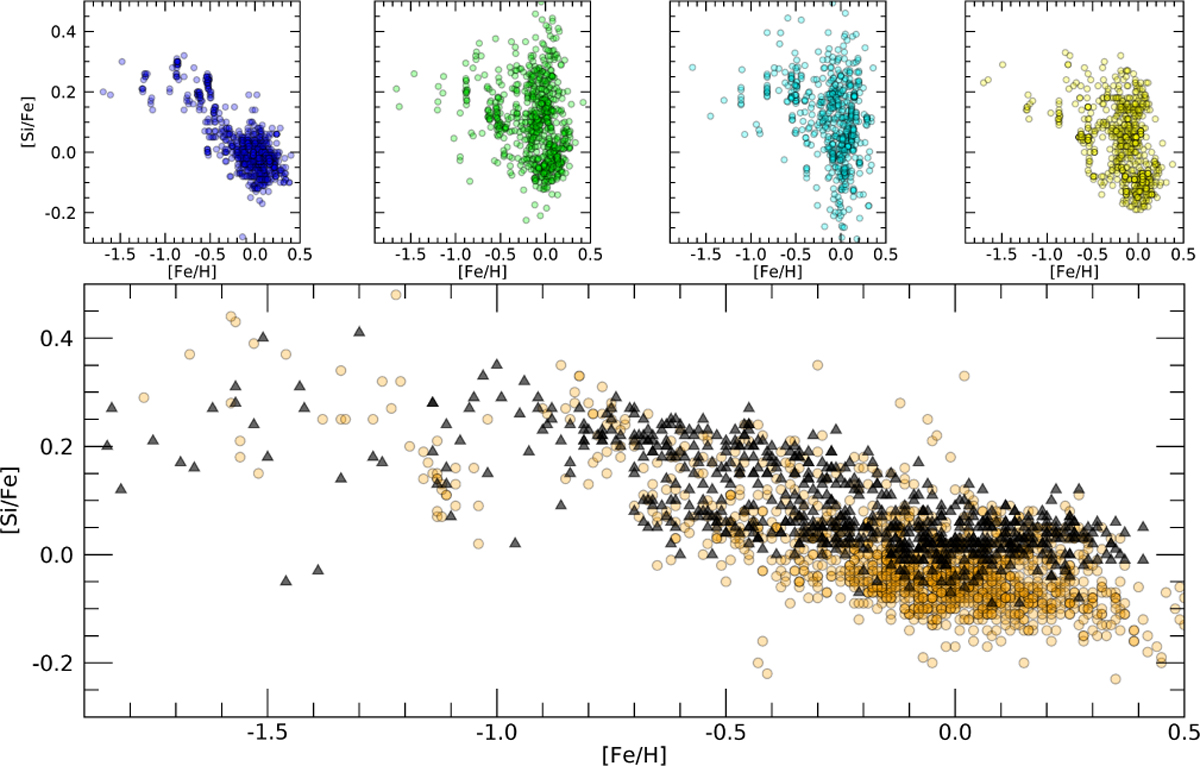
[Si/Fe] vs. [Fe/H] for iDR6. The recommended abundances from WG11 are shown in orange, while the results of the individual nodes are shown in different colours. The black triangles are the abundances from Bensby et al. (2014).
Current usage metrics show cumulative count of Article Views (full-text article views including HTML views, PDF and ePub downloads, according to the available data) and Abstracts Views on Vision4Press platform.
Data correspond to usage on the plateform after 2015. The current usage metrics is available 48-96 hours after online publication and is updated daily on week days.
Initial download of the metrics may take a while.