Fig. 5.
Download original image
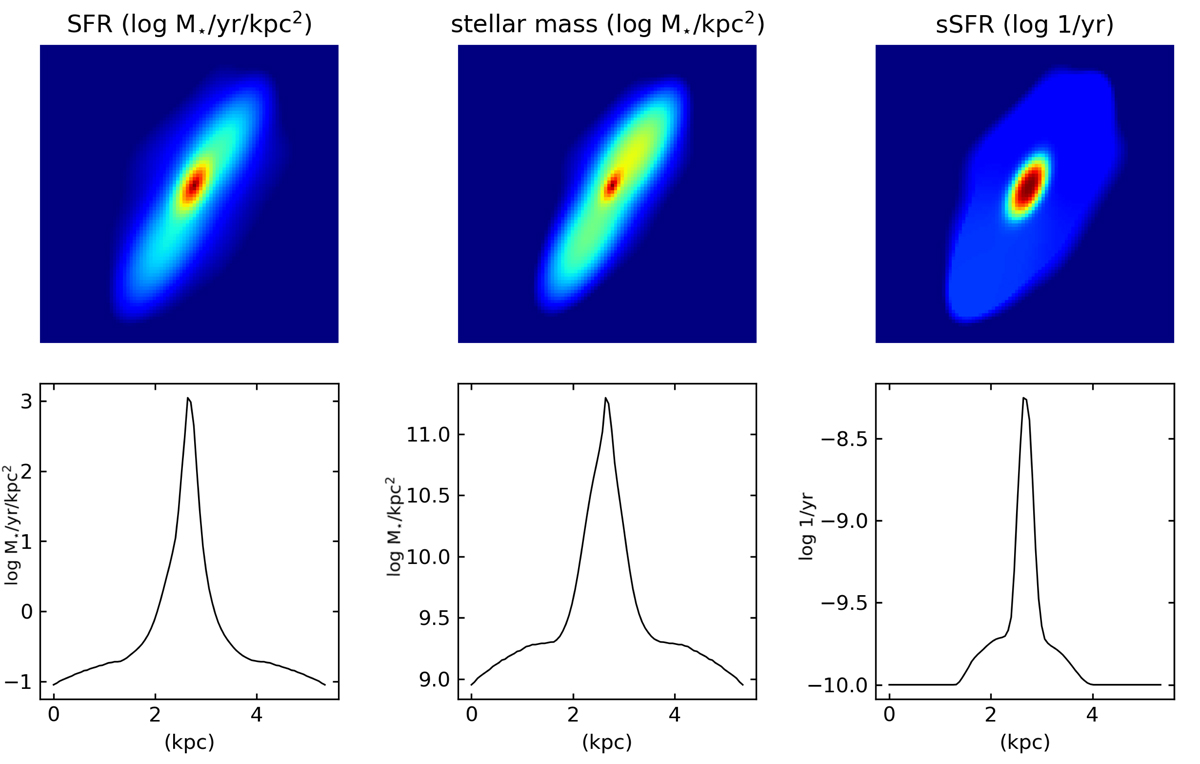
Spatial distribution of Galaxy-B stellar mass and star formation rates. Left: upper panel shows SFR distribution model of Galaxy-B, with the morphology determined by the F160W stellar emission in case of the disk, and the ALMA dust emission for the core. The amplitudes are determined by the SFR of the two components. Lower panel: is a 1D representation of the plot above, after a rotation the make the major axis horizontal. Middle: stellar mass distribution following the same procedure. Here the mass in the core is determined from the difference between the dynamical mass and gas-mass determined from the CO[3−2] emission line. Right: specific SFR provided by the ratio of the SFR and the stellar mass.
Current usage metrics show cumulative count of Article Views (full-text article views including HTML views, PDF and ePub downloads, according to the available data) and Abstracts Views on Vision4Press platform.
Data correspond to usage on the plateform after 2015. The current usage metrics is available 48-96 hours after online publication and is updated daily on week days.
Initial download of the metrics may take a while.