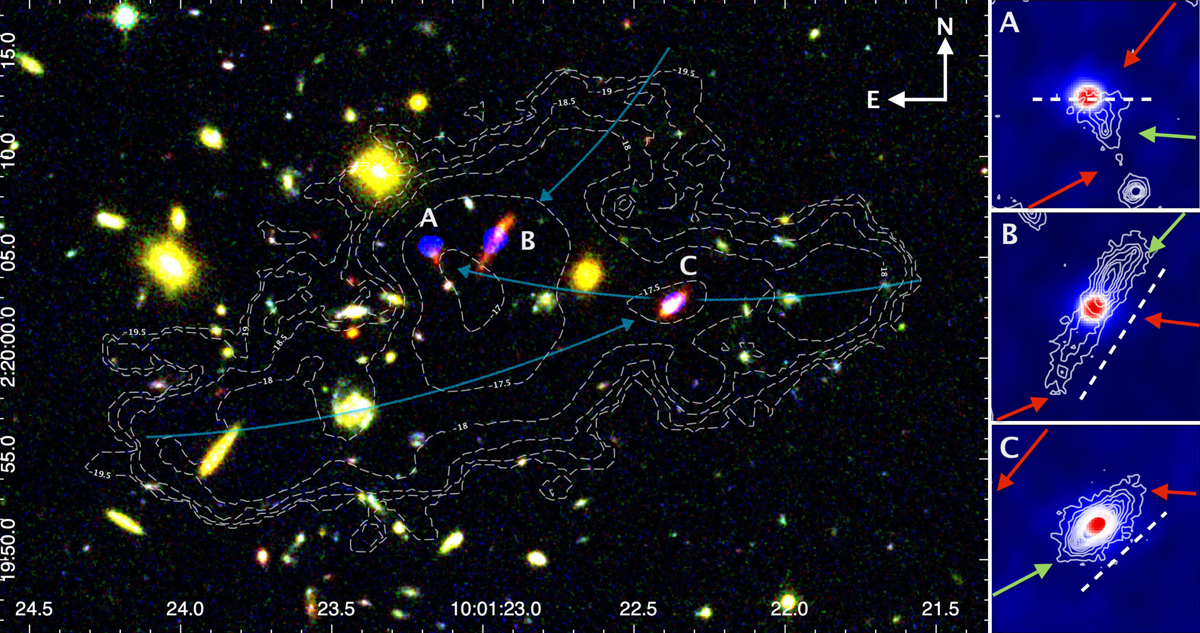
Fig. 1.
Download original image
Location of the massive star-forming galaxies in the network of Lyman-α filaments. Left: color image composite of RO-1001, using observations in F160W, F125W and F606W. The ALMA data has been coadded to that in F606W since both trace star-formation, differing based on dust obscuration. The scaling of the ALMA data was done based on its flux to SFR ratio in comparison to the same for that in F606W. The white dashed contours trace the Lyman-α halo whereas the cyan arrows show the tentative directions of the three gas-accretion filaments converging onto the center of the group potential well (the correspondence to the galaxies is discussed in detail in Sect. 5.2). Right: zoom on the three star-forming galaxies (A, B and C) as seen in ALMA submillimeter dust-emission while the white contours trace the F160W flux tracing stellar light. The contours begin at 4σ with increments of 4σ. The arrows indicate the direction of the streams, which are shown in green if they are aligned with the major axis of the galactic disks (in dashed white lines), as discussed in Sect. 5.2. Those which are not, are in red. In case of Galaxy-A, we rather show the major axis of the ALMA contour with the white dashed line.
Current usage metrics show cumulative count of Article Views (full-text article views including HTML views, PDF and ePub downloads, according to the available data) and Abstracts Views on Vision4Press platform.
Data correspond to usage on the plateform after 2015. The current usage metrics is available 48-96 hours after online publication and is updated daily on week days.
Initial download of the metrics may take a while.