Fig. 8
Download original image
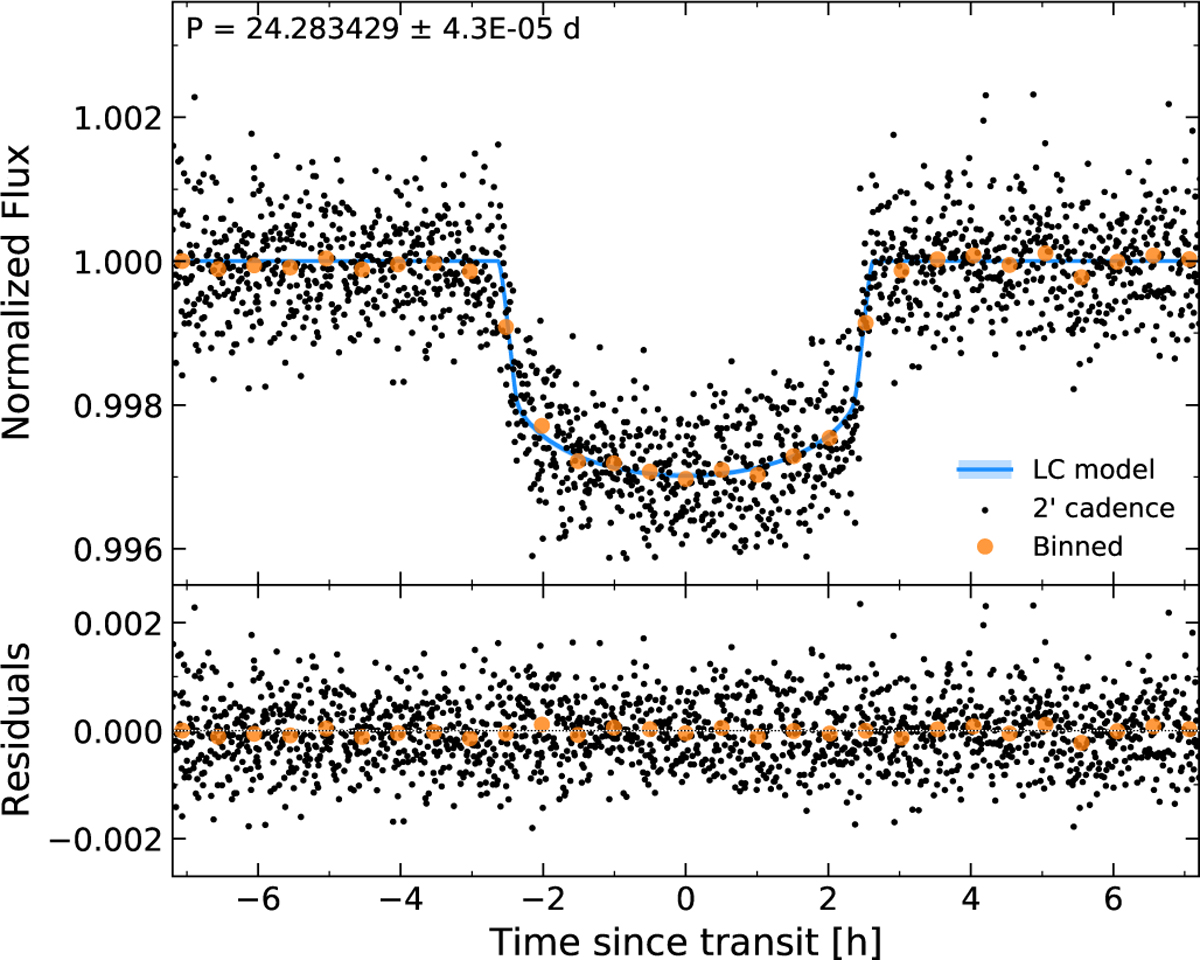
TESS light curve of TOI-1710 folded in phase at the best-fit model period P = 24.283429 days. Shown are the TESS photometric data, acquired with a 2 min cadence (black dots), and the binned light curve, each bin including 59 data points (i.e., ~2 h; larger orange dots). The solid blue line is the best-fit transit model presented in this study (Sect. 4.1) and used to compute the residuals in the bottom panel. Its light blue overlay shows its relative 1 σ uncertainty (indiscernible from the model on this plot).
Current usage metrics show cumulative count of Article Views (full-text article views including HTML views, PDF and ePub downloads, according to the available data) and Abstracts Views on Vision4Press platform.
Data correspond to usage on the plateform after 2015. The current usage metrics is available 48-96 hours after online publication and is updated daily on week days.
Initial download of the metrics may take a while.