Fig. 7
Download original image
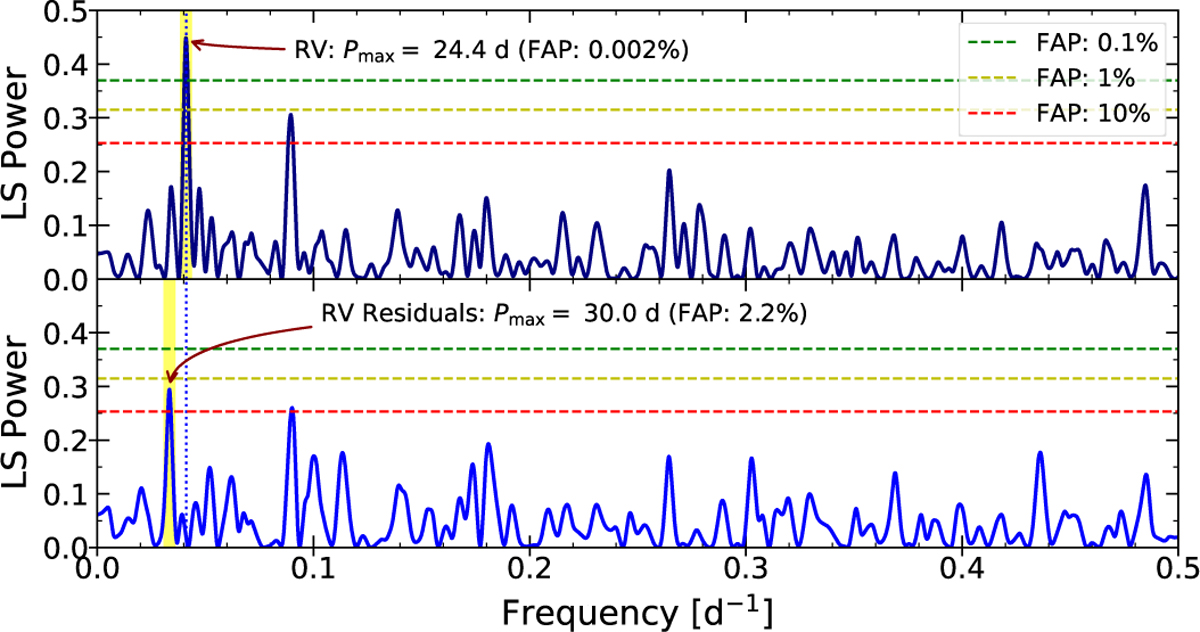
Lomb–Scargle periodograms of the RV (upper panel) and RV residuals (lower panel) time series (including HARPS-N and SOPHIE data). The frequency corresponding to the period of the transiting planet is indicated by a blue dotted vertical line. The frequency of the maximum peak is highlighted with a thick yellow vertical line. The RV residuals are issued from the best-fit model (see Sect. 4.1). The levels of the false alarm probabilities, derived through a bootstrap analysis, are indicated with horizontal dashed lines.
Current usage metrics show cumulative count of Article Views (full-text article views including HTML views, PDF and ePub downloads, according to the available data) and Abstracts Views on Vision4Press platform.
Data correspond to usage on the plateform after 2015. The current usage metrics is available 48-96 hours after online publication and is updated daily on week days.
Initial download of the metrics may take a while.