Fig. 3
Download original image
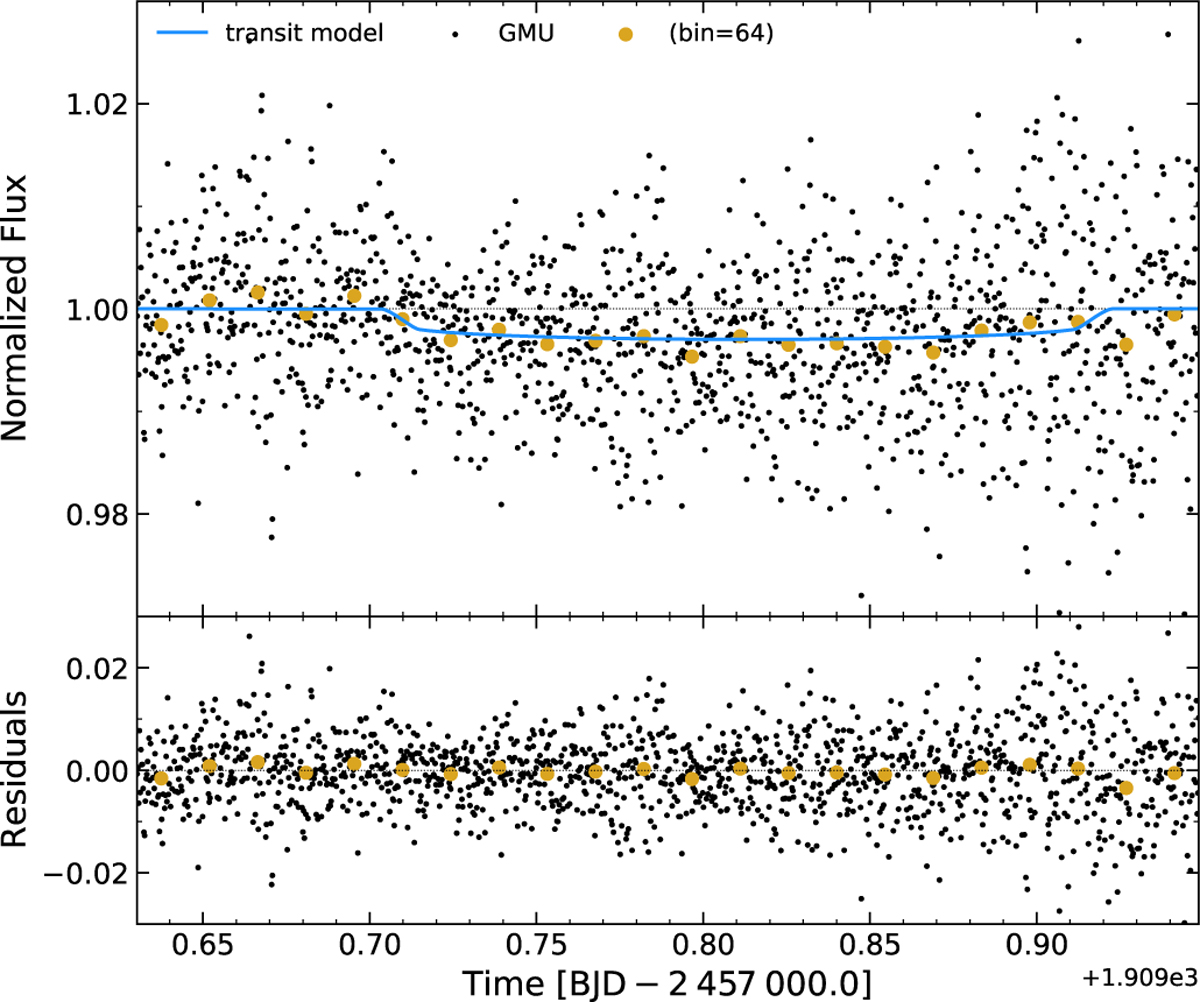
Transit LC of TOI-1710 collected by GMU (upper panel). The black dots represent the airmass-detrended photometric data points, and the larger colored dots the corresponding binned LC. The blue line shows the transit profile of the best-fit model presented in this study (Sect. 4) and is used to compute the residuals presented in the bottom panel.
Current usage metrics show cumulative count of Article Views (full-text article views including HTML views, PDF and ePub downloads, according to the available data) and Abstracts Views on Vision4Press platform.
Data correspond to usage on the plateform after 2015. The current usage metrics is available 48-96 hours after online publication and is updated daily on week days.
Initial download of the metrics may take a while.