Fig. 5.
Download original image
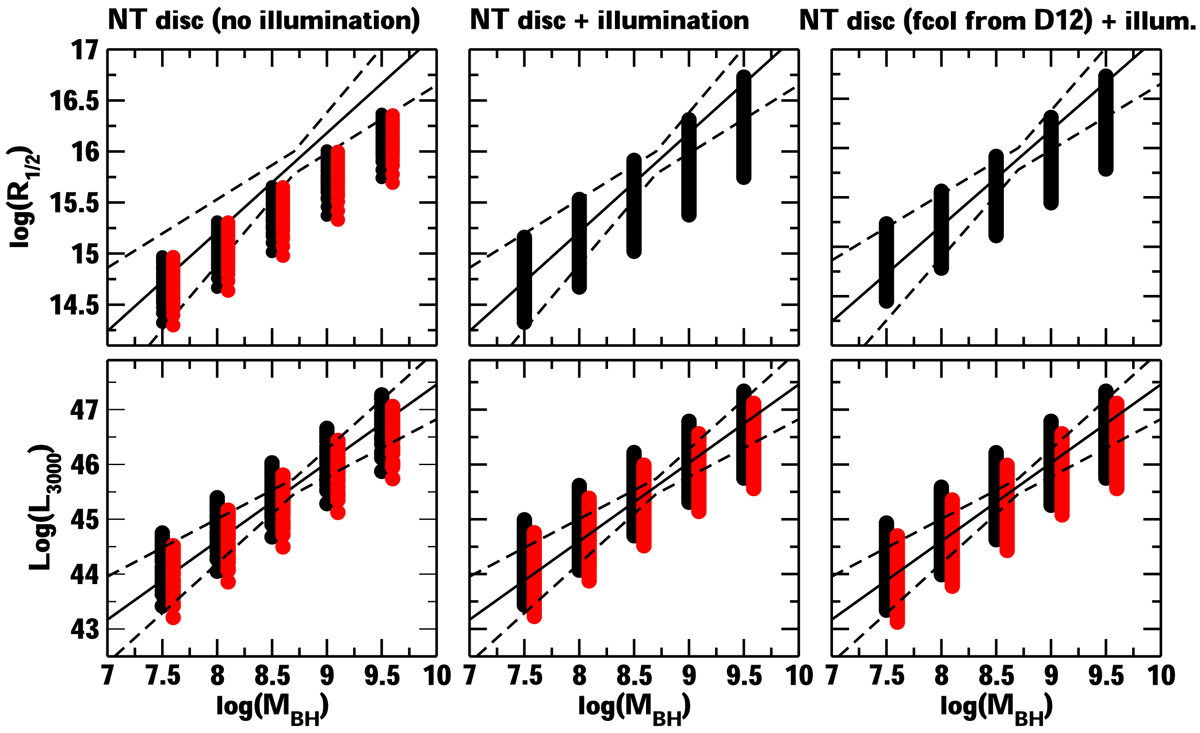
Plot of R1/2, mod and of L3000, mod vs. log(MBH) (upper and lower panels, respectively) in the case of a NT disc (left panels), the NT/X model (middle panels), and the NT/X+fcol model (right panels). Black and red points in the top left panel show the half-light radius for disc inclination 30 and 60 degrees, respectively. Black and red points in the bottom panels indicate the model predictions for θ = 30° and θ = 60°, respectively (R1/2, mod are almost identical for both inclinations). Lines show the best fits to the data, and the 1-σ confidence regions (see text for details).
Current usage metrics show cumulative count of Article Views (full-text article views including HTML views, PDF and ePub downloads, according to the available data) and Abstracts Views on Vision4Press platform.
Data correspond to usage on the plateform after 2015. The current usage metrics is available 48-96 hours after online publication and is updated daily on week days.
Initial download of the metrics may take a while.