Fig. 3.
Download original image
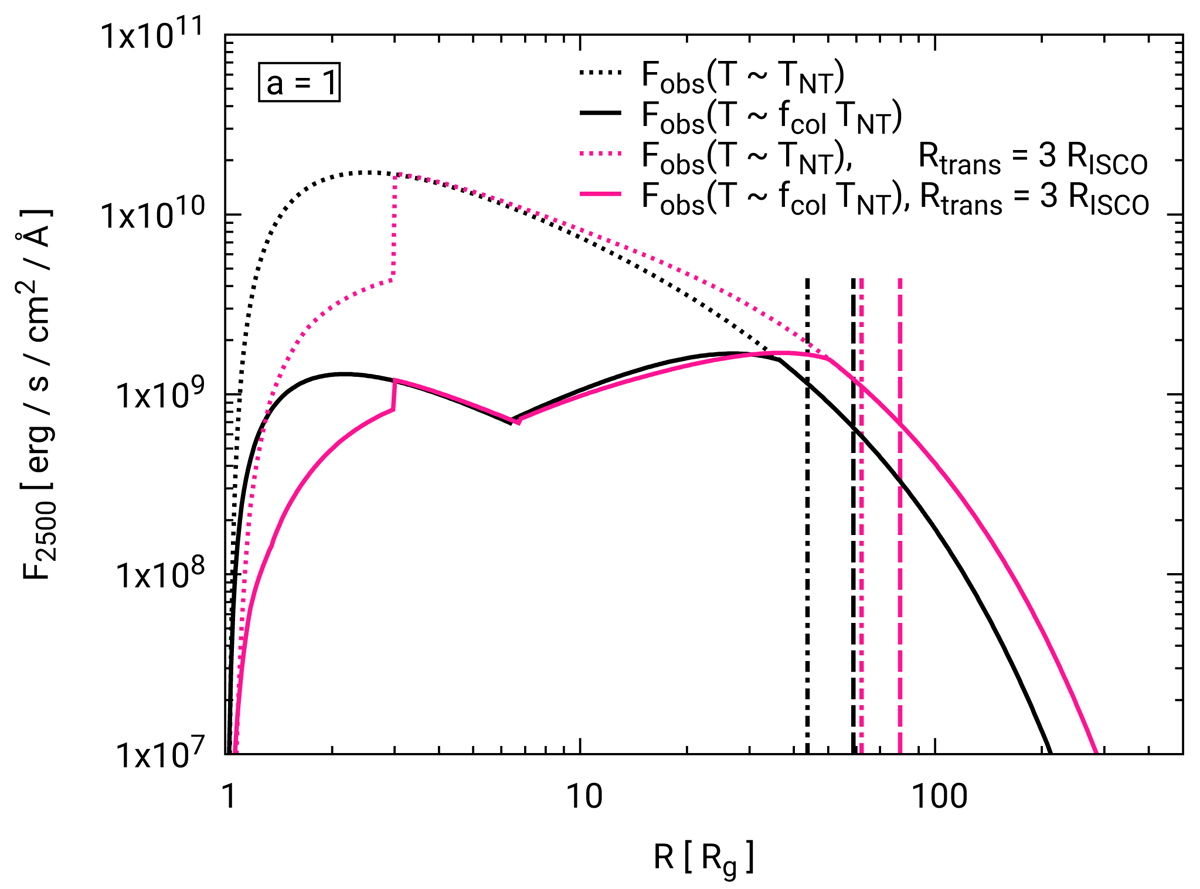
Magenta lines show the radial flux profile (for one side of the disc) at 2500 Å (as seen at infinity) when the disc is illuminated by an X-ray corona at h = 20 Rg and Rtr = 3RISCO for BH with a* = 1. All other model parameters are the same as in Fig. 2. Dotted and solid lines indicate the profile for a NT disc and when we assume the colour correction factor of Done et al. (2012), respectively. The black lines are the same as the black lines in Fig. 2, and are shown for comparison. The vertical dashed lines show the location of R1/2, mod for each radial profile.
Current usage metrics show cumulative count of Article Views (full-text article views including HTML views, PDF and ePub downloads, according to the available data) and Abstracts Views on Vision4Press platform.
Data correspond to usage on the plateform after 2015. The current usage metrics is available 48-96 hours after online publication and is updated daily on week days.
Initial download of the metrics may take a while.