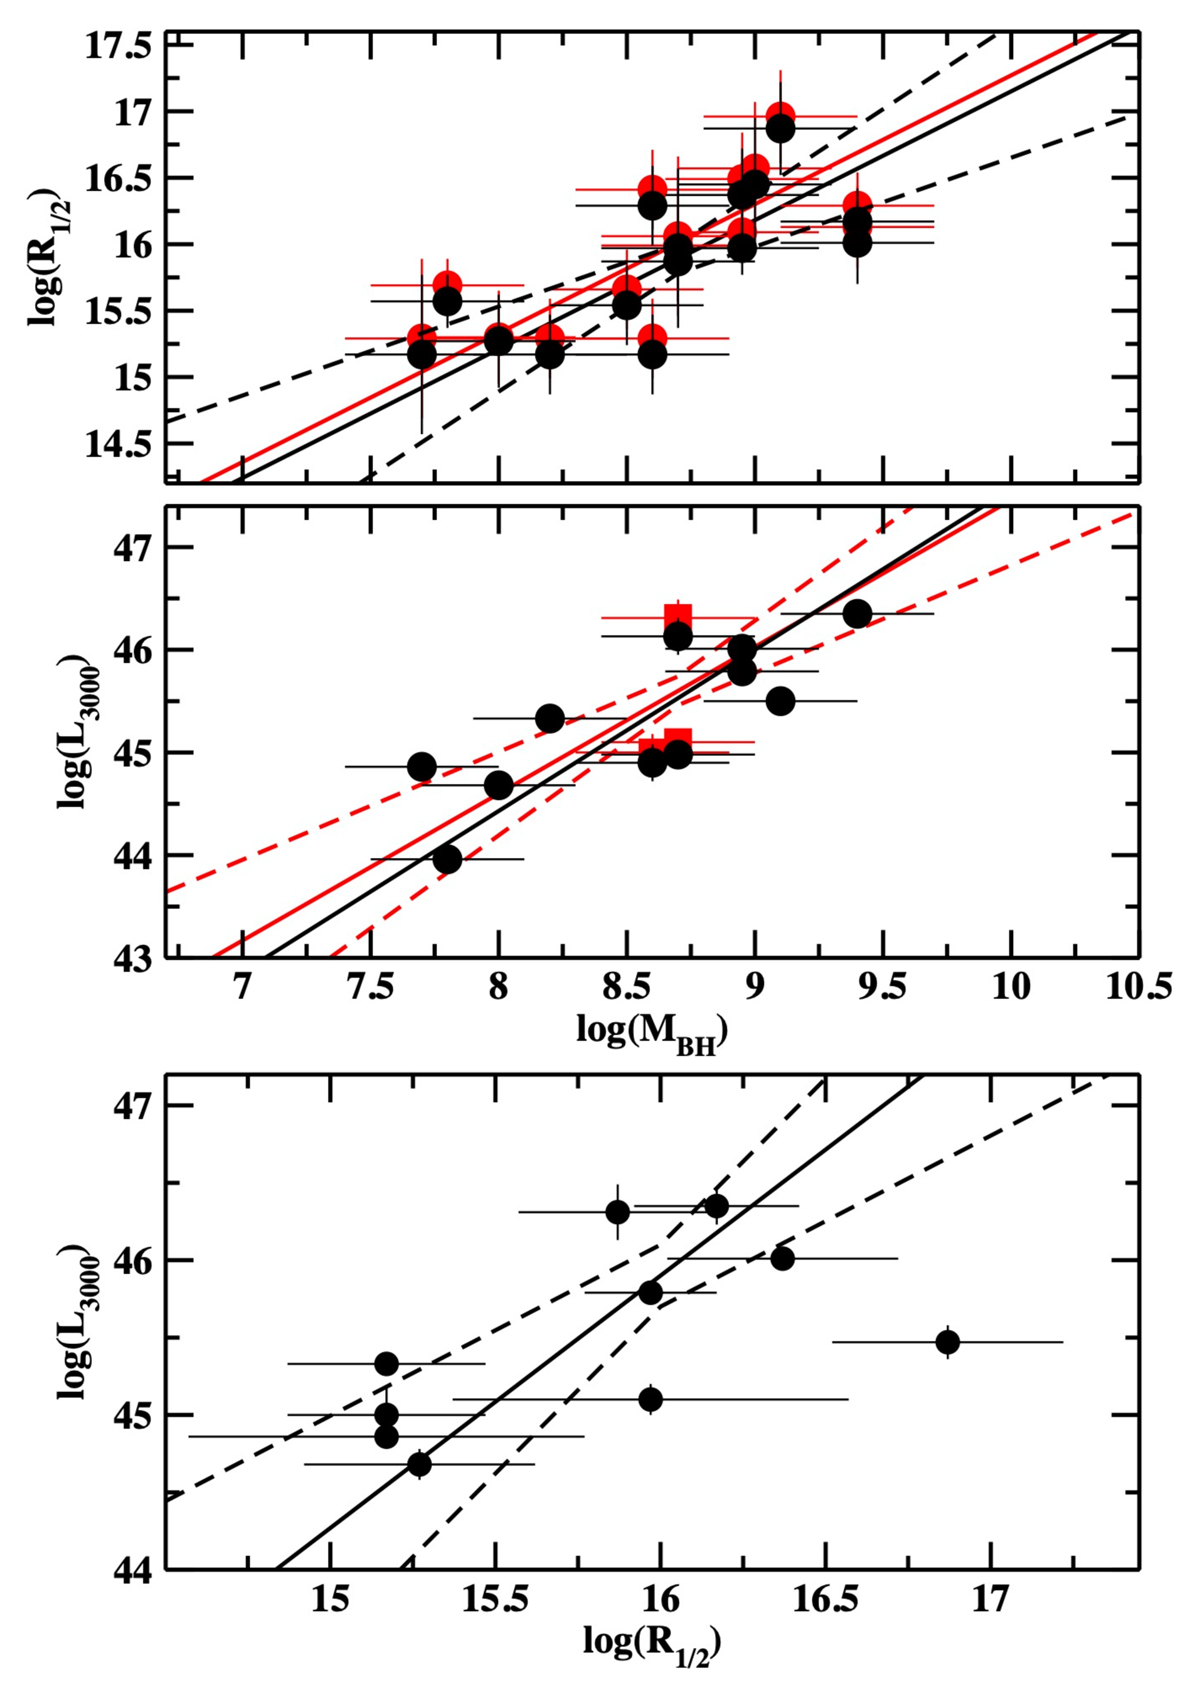
Fig. 1.
Download original image
Log(R1/2) and log(L3000) vs. log(MBH) (upper and middle panels, respectively). Black and red circles in the top panel show R1/2 assuming an inclination angle of 30° and 60°, respectively. Red points in the middle plot show data after correcting for intrinsic absorption as well. A plot of log(L3000) vs. logarithm of half half-light radius is shown in the bottom panel. Solid lines show the best fit to the data, while dashed lines show the 1σ confidence regions (see text for details).
Current usage metrics show cumulative count of Article Views (full-text article views including HTML views, PDF and ePub downloads, according to the available data) and Abstracts Views on Vision4Press platform.
Data correspond to usage on the plateform after 2015. The current usage metrics is available 48-96 hours after online publication and is updated daily on week days.
Initial download of the metrics may take a while.