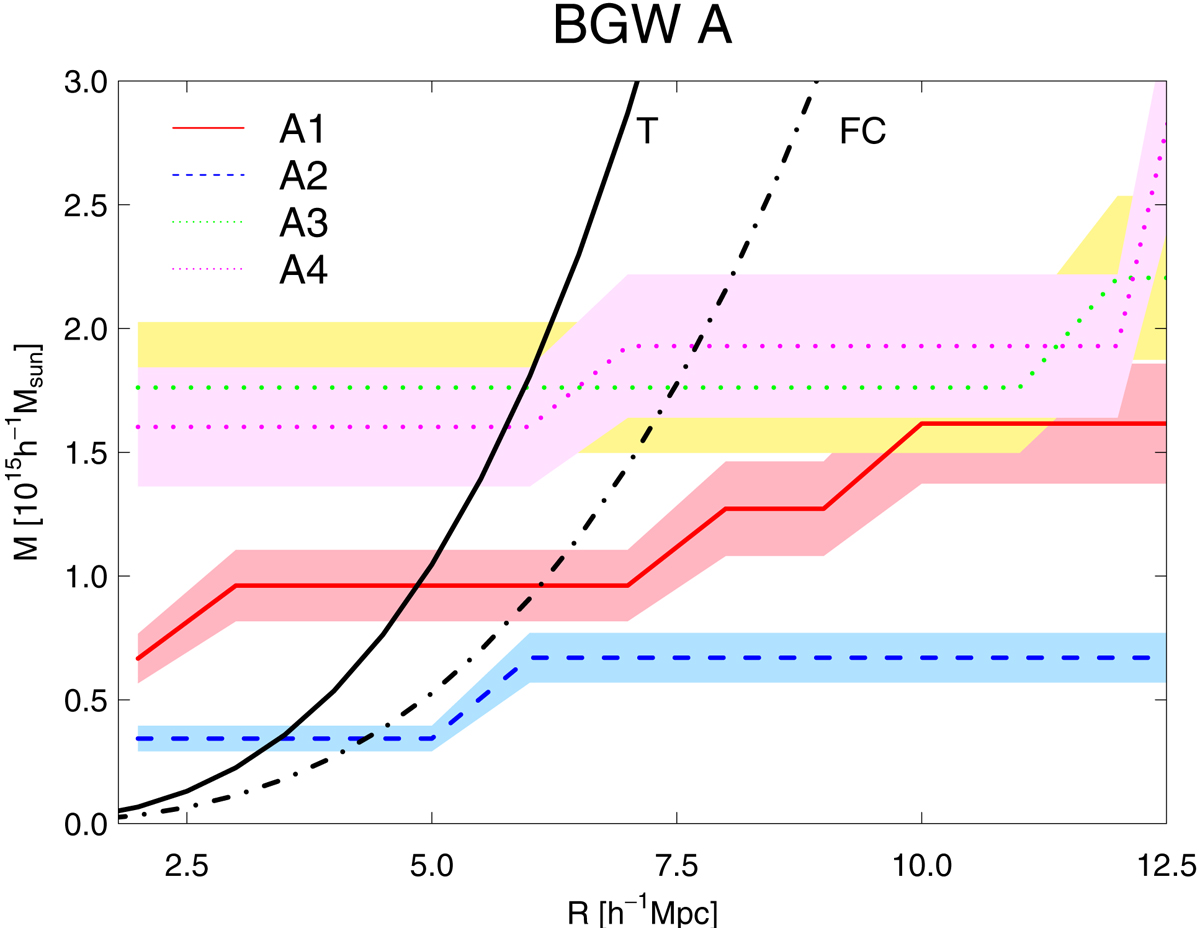
Fig. 5.
Download original image
Mass-radius relation for HDCs of BGW supercluster A. Red solid line – A1; blue dashed line – A2; green dashed line – A3; violet dotted line – A4. Black solid and dotted lines show turnaround (T) and future collapse (FC) mass (MT(R) and MFC(R)) versus radius of a sphere R at redshift z = 0.5, correspondingly. Dashed areas show 15% mass errors, as explained in the text.
Current usage metrics show cumulative count of Article Views (full-text article views including HTML views, PDF and ePub downloads, according to the available data) and Abstracts Views on Vision4Press platform.
Data correspond to usage on the plateform after 2015. The current usage metrics is available 48-96 hours after online publication and is updated daily on week days.
Initial download of the metrics may take a while.