Fig. 4.
Download original image
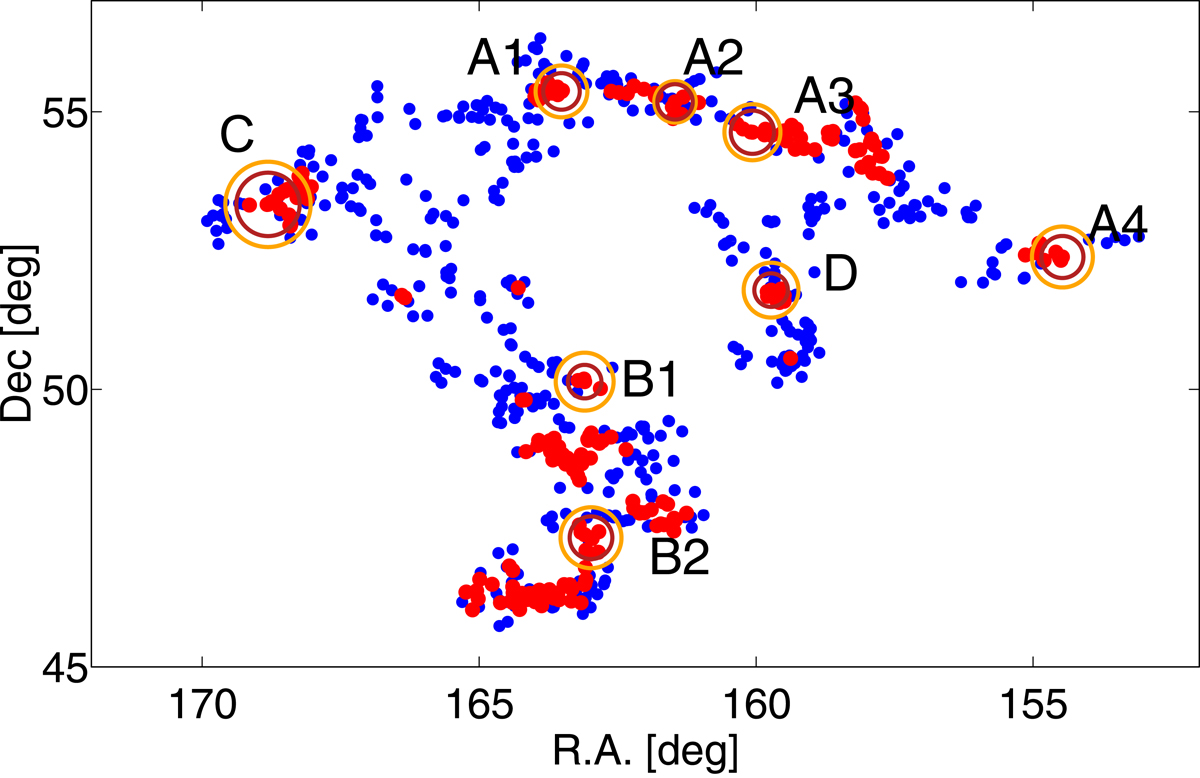
Distribution of galaxies in BGW superclusters in the sky plane. Red dots denote galaxies in the possible HDCs of each supercluster, and blue dots show galaxies in outskirts. Luminosity limits for HDCs are as follows: D8HDC ≥ 15 in BGW A, D8HDC ≥ 11 in BGW B, D8HDC ≥ 14.5 in BGW C, and D8HDC ≥ 16 in BGW D, where D8 is the value of the luminosity density (see text). Dark red circles show the turnaround regions in each HDC, and orange circles show the future collapse regions. Numbers with labels denote HDCs in each BGW supercluster.
Current usage metrics show cumulative count of Article Views (full-text article views including HTML views, PDF and ePub downloads, according to the available data) and Abstracts Views on Vision4Press platform.
Data correspond to usage on the plateform after 2015. The current usage metrics is available 48-96 hours after online publication and is updated daily on week days.
Initial download of the metrics may take a while.