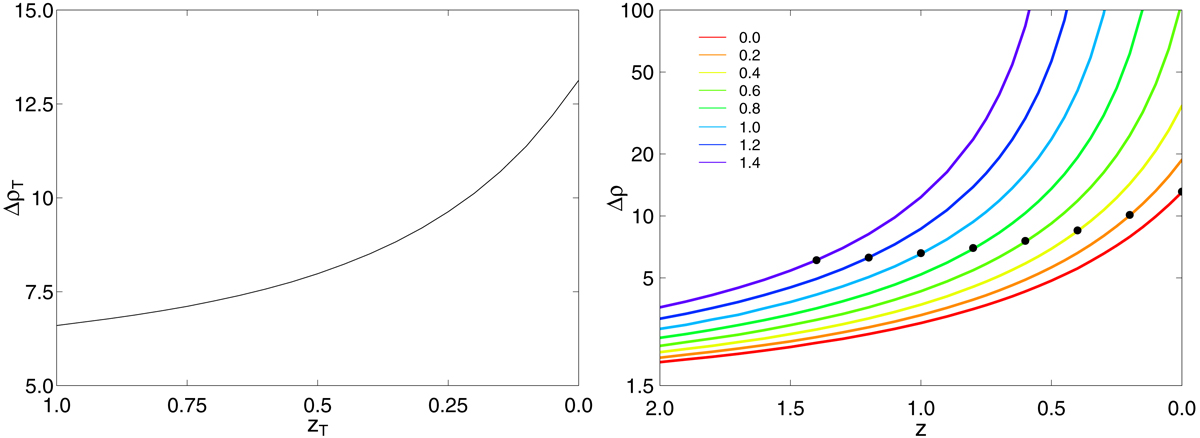
Fig. 2.
Download original image
Turnaround density contrast ΔρT versus redshift at which turnaround occurs, zT (left panel) and evolution of the density contrast Δρ(t) in the spheres, where the turnaround happens at redshifts z = 0.0–1.4 (right panel). Corresponding redshifts are shown in the figure. Points on each curve show the turnaround density contrast ΔρT at a corresponding redshift.
Current usage metrics show cumulative count of Article Views (full-text article views including HTML views, PDF and ePub downloads, according to the available data) and Abstracts Views on Vision4Press platform.
Data correspond to usage on the plateform after 2015. The current usage metrics is available 48-96 hours after online publication and is updated daily on week days.
Initial download of the metrics may take a while.