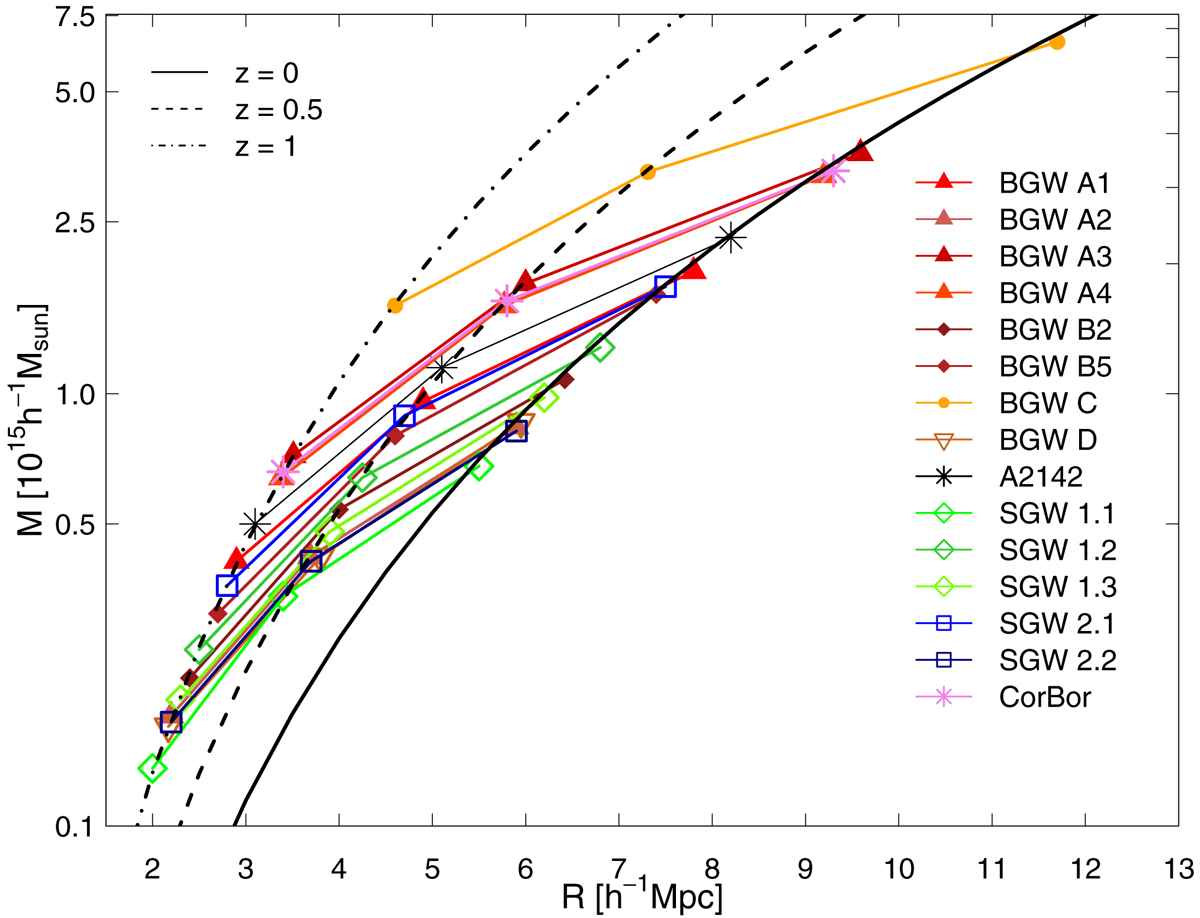
Fig. 10.
Download original image
Turnaround mass versus the radius of the turnaround region in the HDCs of superclusters at different redshifts. For each HDC, the turnaround mass and radius are plotted at redshifts z = 0 (right point), z = 0.5 (middle point), and z = 1 (left point). Legend lists HDCs of superclusters plotted in the figure. Black lines show theoretical mass – radius relation for redshifts z = 0.0 (solid line), z = 0.5 (dashed line), and z = 1.0 (dot-dashed line) (Sect. 3.1).
Current usage metrics show cumulative count of Article Views (full-text article views including HTML views, PDF and ePub downloads, according to the available data) and Abstracts Views on Vision4Press platform.
Data correspond to usage on the plateform after 2015. The current usage metrics is available 48-96 hours after online publication and is updated daily on week days.
Initial download of the metrics may take a while.