Open Access
Fig. 1.
Download original image
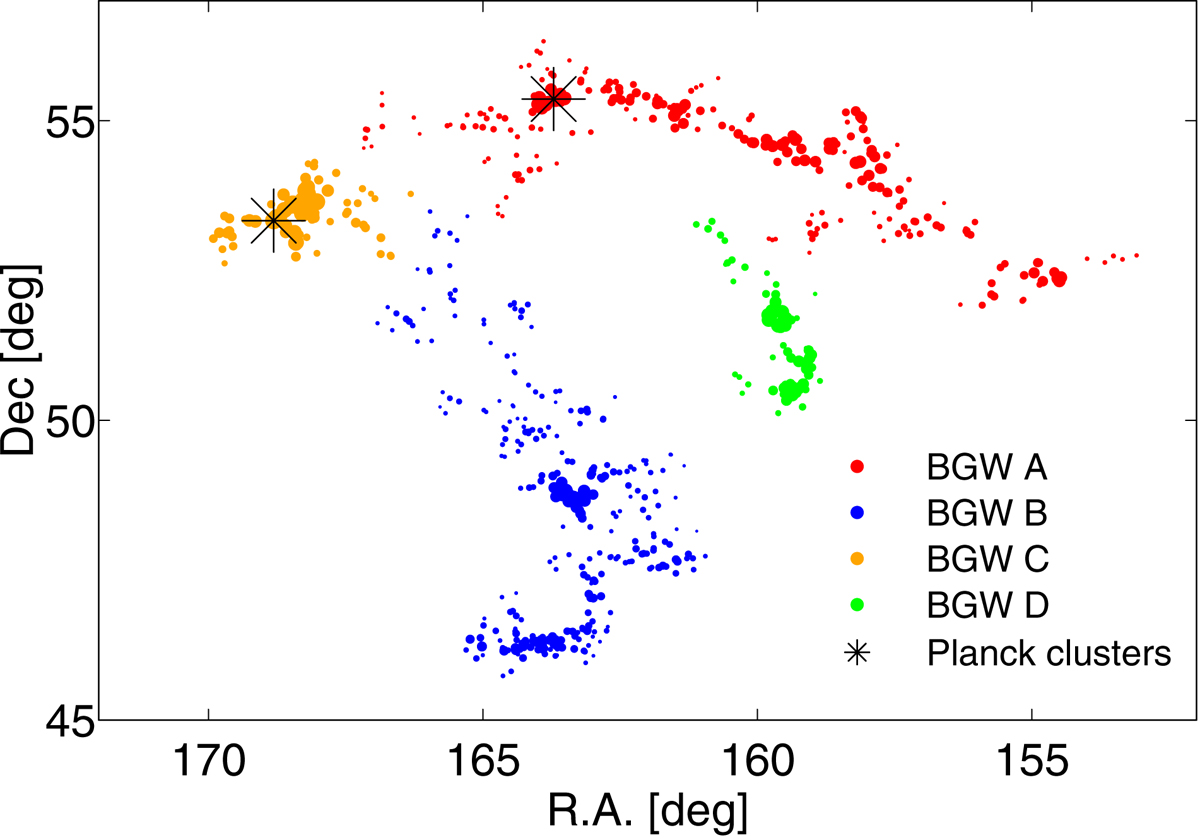
Distribution of galaxies in BGW superclusters in the sky plane. Red dots denote galaxies in BGW A, blue dots in BGW B, yellow dots in BGW C, and green dots in BGW D. Symbol sizes are proportional to the value of the density field at the location of a galaxy. Stars denote the location of Planck clusters.
Current usage metrics show cumulative count of Article Views (full-text article views including HTML views, PDF and ePub downloads, according to the available data) and Abstracts Views on Vision4Press platform.
Data correspond to usage on the plateform after 2015. The current usage metrics is available 48-96 hours after online publication and is updated daily on week days.
Initial download of the metrics may take a while.