Open Access
Fig. 5
Download original image
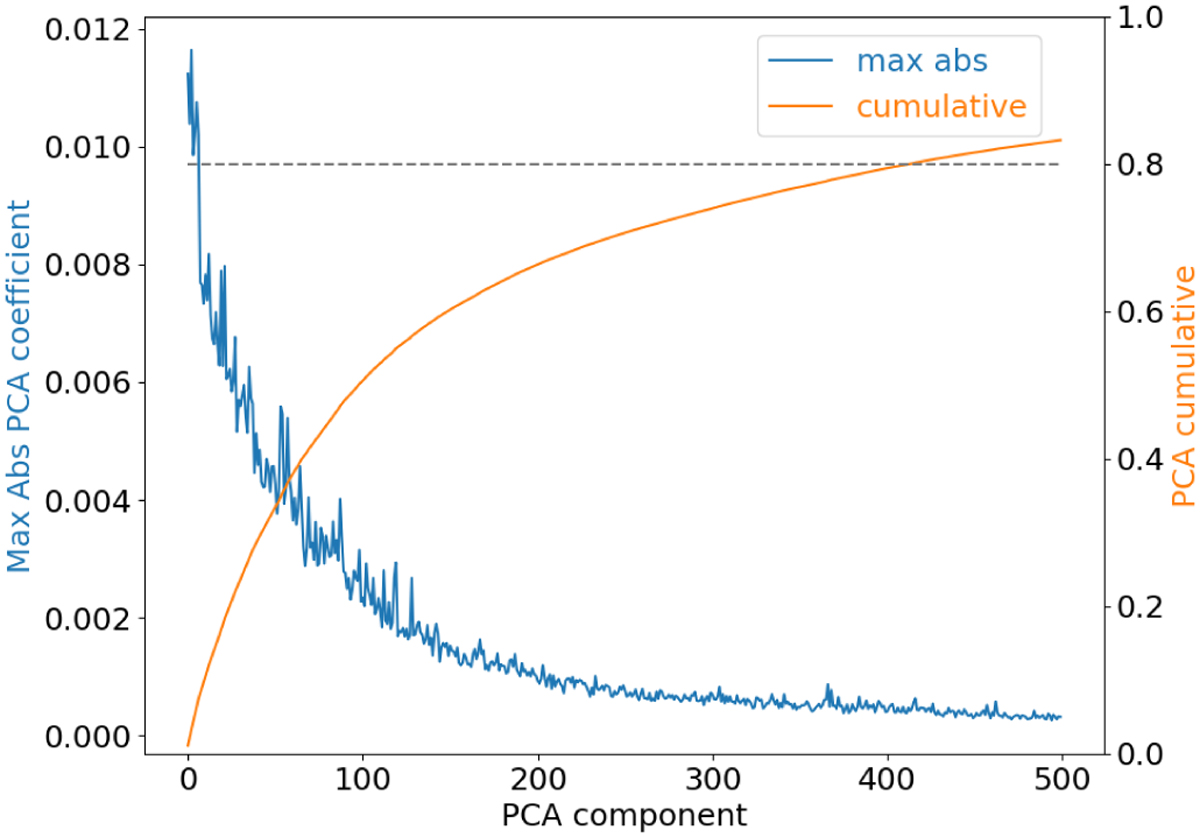
Contribution of PCA components to image information. Blue: maximum absolute value for each PCA coefficient across all images used to create the basis. Orange: cumulative value of all previous PCA coefficients. The dashed grey line is the 0.8 limit reference reached using more than 400 PCA components.
Current usage metrics show cumulative count of Article Views (full-text article views including HTML views, PDF and ePub downloads, according to the available data) and Abstracts Views on Vision4Press platform.
Data correspond to usage on the plateform after 2015. The current usage metrics is available 48-96 hours after online publication and is updated daily on week days.
Initial download of the metrics may take a while.