Open Access
Fig. 18
Download original image
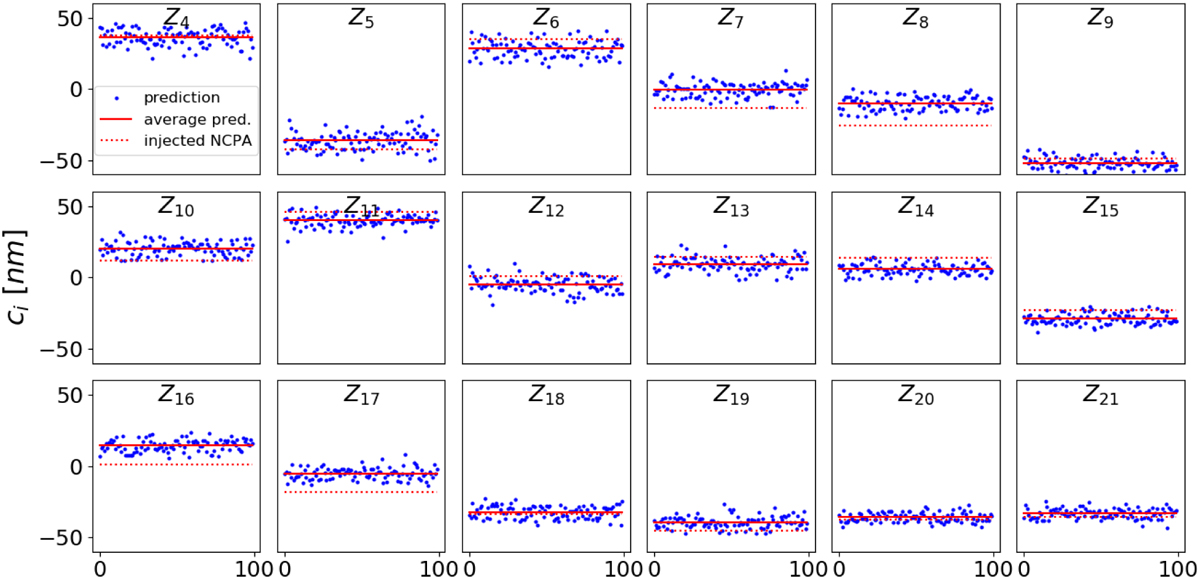
Comparison of injected (red dotted line) and averaged prediction of NCPA component (red line) for each Zi in the simulation when NCPA is fixed over the whole dataset of 100 images while the turbulence is evolving. Blue dots are the single NN predictions for NCPA.
Current usage metrics show cumulative count of Article Views (full-text article views including HTML views, PDF and ePub downloads, according to the available data) and Abstracts Views on Vision4Press platform.
Data correspond to usage on the plateform after 2015. The current usage metrics is available 48-96 hours after online publication and is updated daily on week days.
Initial download of the metrics may take a while.