Fig. 17
Download original image
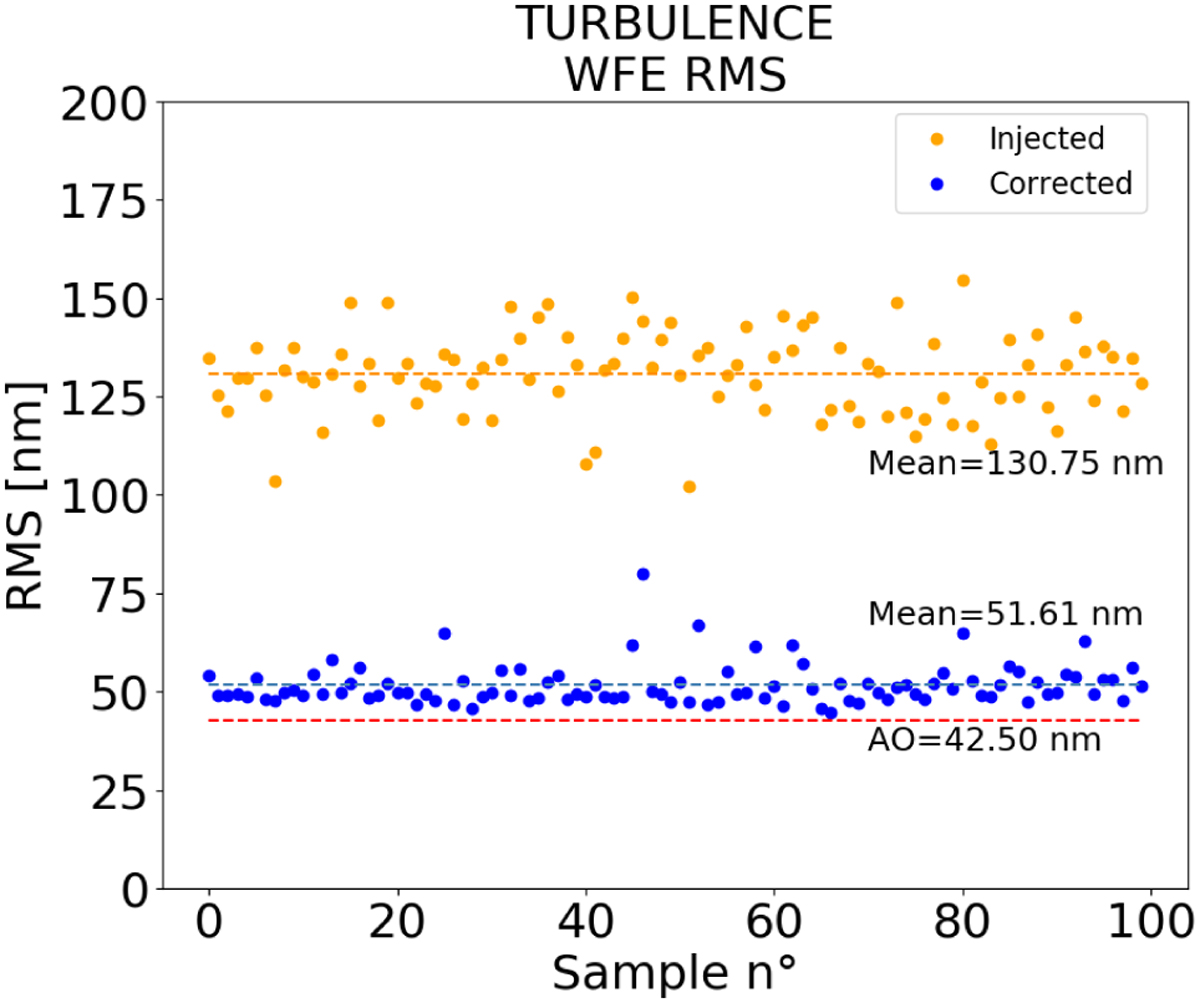
NCPA correction in case of ≈42.5 nm turbulence based on our NN model predictions. Dashed lines represent the mean, over the entire testing-set, of initial and corrected values. The red dashed line is the AO system limit without NCPA. In this test set every image has both different AO residuals and different NCPA aberrations.
Current usage metrics show cumulative count of Article Views (full-text article views including HTML views, PDF and ePub downloads, according to the available data) and Abstracts Views on Vision4Press platform.
Data correspond to usage on the plateform after 2015. The current usage metrics is available 48-96 hours after online publication and is updated daily on week days.
Initial download of the metrics may take a while.