Fig. 1
Download original image
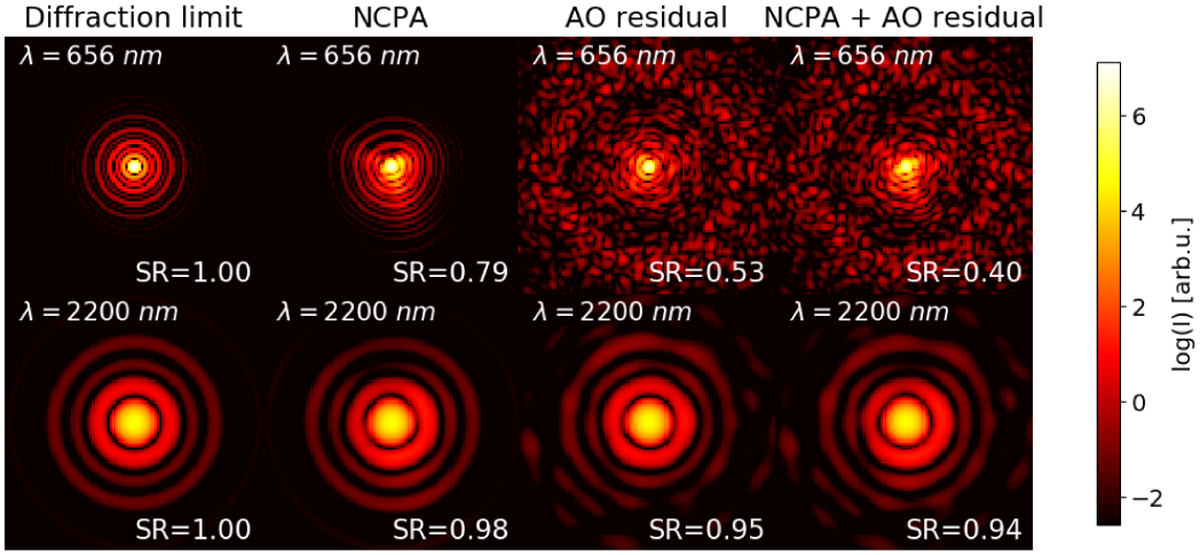
Focal-plane images simulated at two different wavelengths: Hα = 656 nm and K band = 2200 nm. From left to right: diffraction limited PSF; PSF with NCPAs of WFECPA ≈ 50 nm RMS; PSFs with AO residual WFEAO ≈ 100 nm RMS; PSFs with AO residuals and NCPAs.The Strehl ratio (SR) is calculated using Szapiel (1983); Ross (2009). The NCPA effect is clearly stronger at the shorter Hα wavelength.
Current usage metrics show cumulative count of Article Views (full-text article views including HTML views, PDF and ePub downloads, according to the available data) and Abstracts Views on Vision4Press platform.
Data correspond to usage on the plateform after 2015. The current usage metrics is available 48-96 hours after online publication and is updated daily on week days.
Initial download of the metrics may take a while.