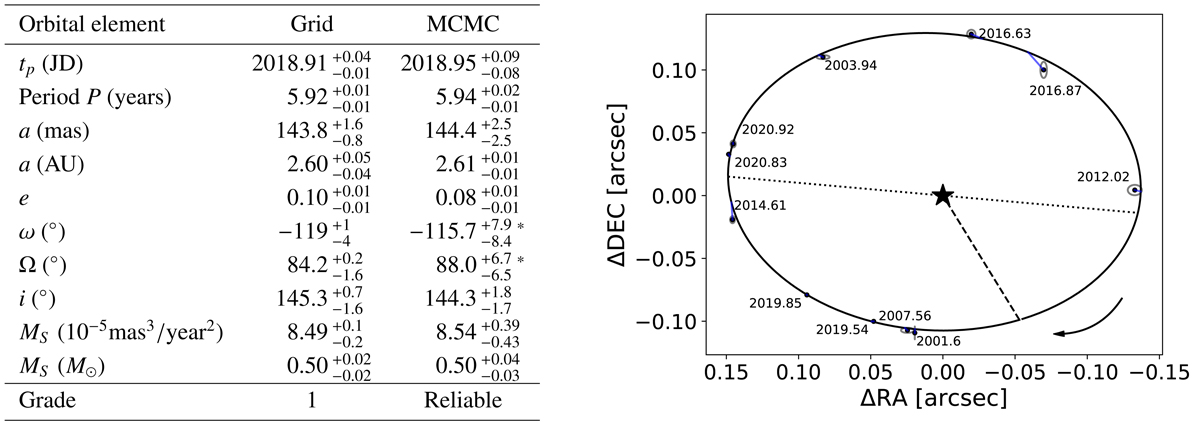
Fig. B.1.
Download original image
Orbital parameters and fit for J0008. The right panel show the best fit from the grid approach, with black dots representing the astrometric data and the grey ellipses their uncertainty. The periastron is represented with the dashed line, with the dotted line the line of nodes. The blue lines connect the observations with their expected fitted values. The orbital solution from the MCMC are given in Appendix A. The asterisk (*) next to ω and Ω values for the MCMC indicate the pair to be defined with a ±180° degeneracy.
Current usage metrics show cumulative count of Article Views (full-text article views including HTML views, PDF and ePub downloads, according to the available data) and Abstracts Views on Vision4Press platform.
Data correspond to usage on the plateform after 2015. The current usage metrics is available 48-96 hours after online publication and is updated daily on week days.
Initial download of the metrics may take a while.