Fig. 3.
Download original image
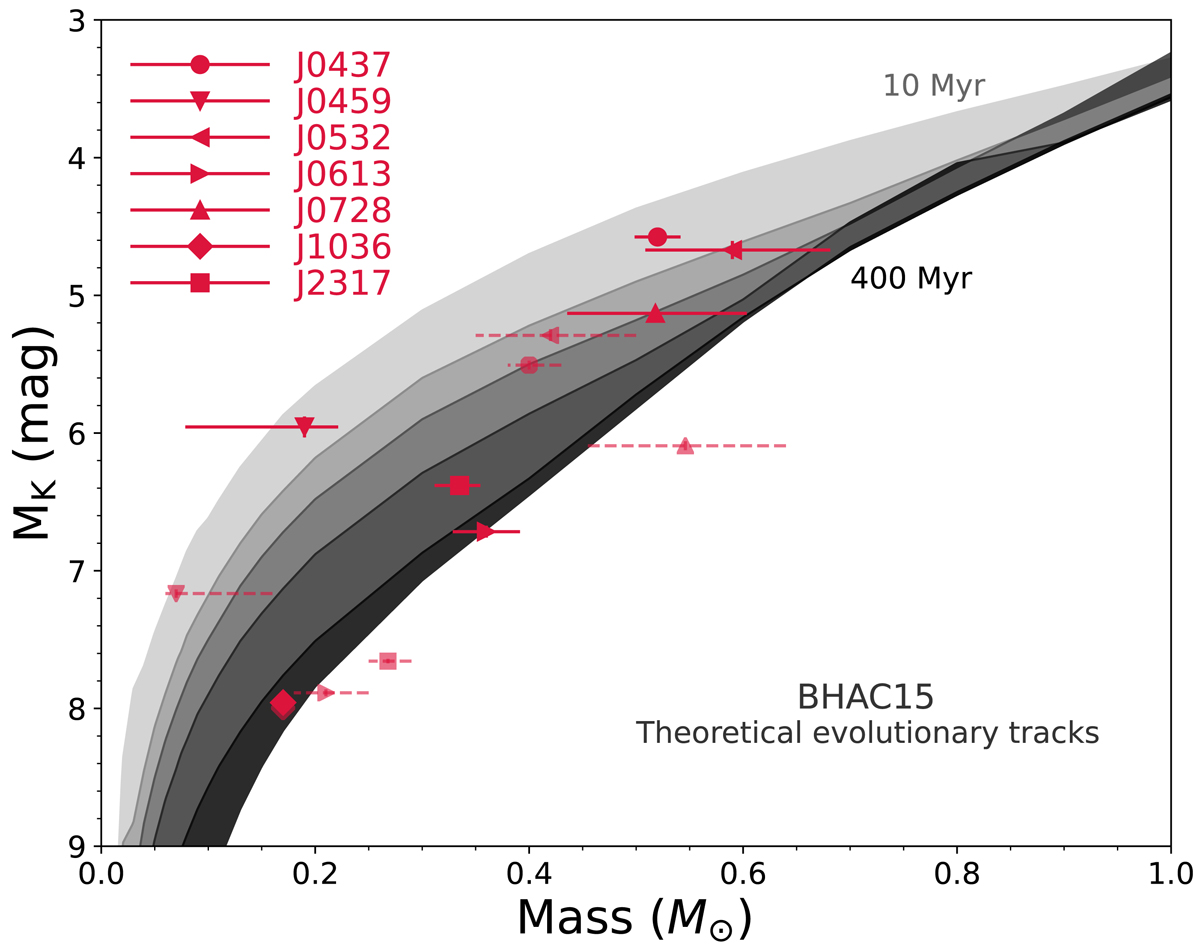
Mass-magnitude diagram of the individual components for the targets we were able to resolve and derive dynamical masses for. The filled areas display isochrones with ages ranging from 10, 20, 30, 50, 120 to 400 Myr from the BHAC15 models. Each binary pair is represented by a different set of symbols, with the secondary component being slightly faded out and having dashed lines for the uncertainty. For J1036 the masses and brightnesses are equal and the two components are overplotted on top of eachother. Magnitudes here are shown as absolute magnitudes, which are also listed in Table 8 together the distances and corresponding theoretical masses for the approximate age-range of the associated YMG.
Current usage metrics show cumulative count of Article Views (full-text article views including HTML views, PDF and ePub downloads, according to the available data) and Abstracts Views on Vision4Press platform.
Data correspond to usage on the plateform after 2015. The current usage metrics is available 48-96 hours after online publication and is updated daily on week days.
Initial download of the metrics may take a while.