Fig. B.26.
Download original image
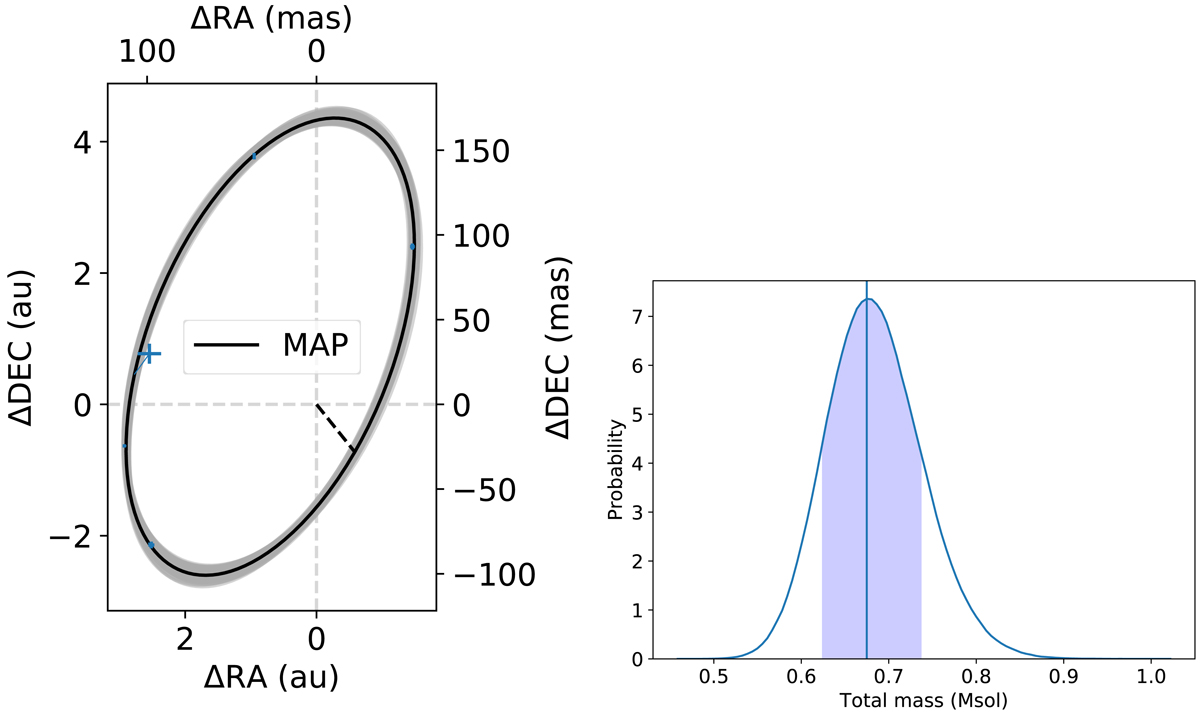
J232617 orbits and mass-distribution from the MCMC algorithm. For the left panel, we randomly picked one hundred orbits from the MCMC solutions represented by the grey lines, and plotted the astrometry with the errorbars in blue. The black line represent the Maximum A Posteriori (MAP) estimate, i.e. the most likely solution. For the right panel the blue lines depict the peak probability and corresponding dynamical mass, with the shaded light-blue area encompassing the 16 − 84 % confidence interval.
Current usage metrics show cumulative count of Article Views (full-text article views including HTML views, PDF and ePub downloads, according to the available data) and Abstracts Views on Vision4Press platform.
Data correspond to usage on the plateform after 2015. The current usage metrics is available 48-96 hours after online publication and is updated daily on week days.
Initial download of the metrics may take a while.