Fig. 9
Download original image
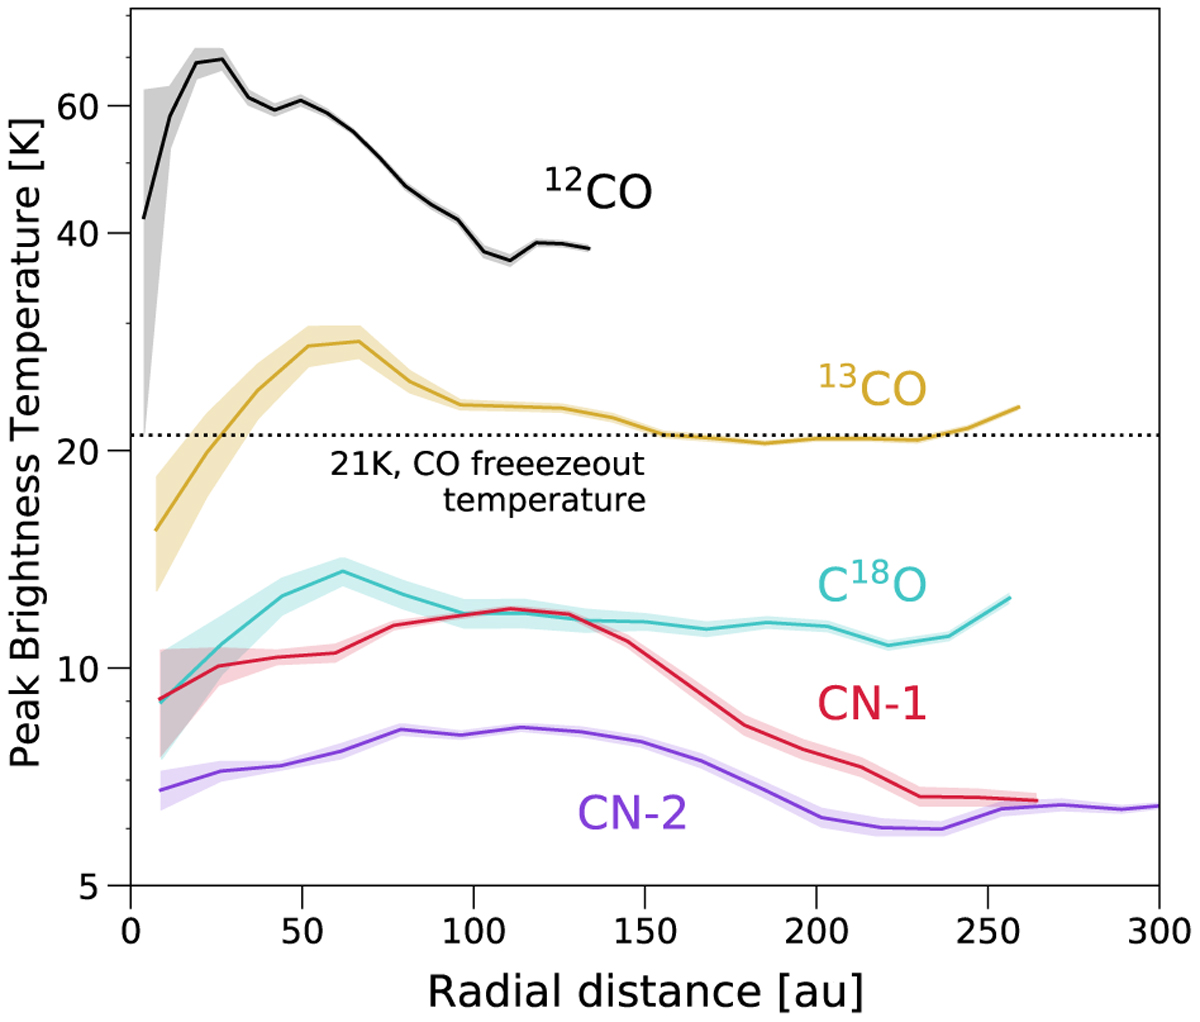
Azimuthally averaged peak brightness temperature profiles of each tracer available for Elias 2-27. The data are extracted only from the west side of the disk to avoid the high absorption effects of the east. In the case of CN the data are only from the south side, due to the additional north-south emission asymmetry. The shadowed colored regions show the uncertainty in the azimuthal averaging of the peak brightness temperature maps, obtained by dividing the standard deviation by the number of independent beams in each radial bin area.
Current usage metrics show cumulative count of Article Views (full-text article views including HTML views, PDF and ePub downloads, according to the available data) and Abstracts Views on Vision4Press platform.
Data correspond to usage on the plateform after 2015. The current usage metrics is available 48-96 hours after online publication and is updated daily on week days.
Initial download of the metrics may take a while.